
Insight
Indian-American giving by metro: what our database shows
About 5% of the $1M+ Indian Americans in our database have a public giving signal. Here is how that varies by kind, cause and metro.
Philanthropy is one of the clearest public traces wealth leaves. A seat on a hospital board, a name on a university donor roll or a role at a family foundation is public record, and each tells a fundraiser something about capacity and interest. HeyAlbert records these as giving signals on the people in our database.
Of the 93,456 people in our database at an estimated $1M+, 4,859 (about 5.2%) have at least one public giving signal [1] (our calculation). This post breaks those signals down by kind, by cause and by metro.
What counts as a giving signal
Board service is by far the most common signal: 2,721 people in our $1M+ set sit on the board of at least one charity or nonprofit [1]. Named gifts on donor rolls come next, then officer and trustee roles at private foundations, including 681 people connected to a family foundation [1].
| Kind of signal | People with this signal |
|---|---|
| Board seat at a charity or nonprofit | 2,721 |
| Named donor on a gift roll | 1,128 |
| Officer or trustee of a family foundation | 681 |
| Officer or trustee of another private foundation | 544 |
| Unpaid officer of a nonprofit | 125 |
Source: HeyAlbert database [1], people at $1M+. A person can have more than one kind of signal.
Which causes
Where we can classify the organization, education leads (1,106 people), followed by community and ethnic organizations (906), human services (752) and health (668) [1]. A large group (1,521) is connected to organizations that fall outside these categories or that we have not yet classified [1].
| Cause area | People with a signal |
|---|---|
| Other causes | 1,521 |
| Education | 1,106 |
| Community and ethnic organizations | 906 |
| Human services | 752 |
| Health | 668 |
| Arts and culture | 494 |
| Religion | 101 |
| Environment | 96 |
Source: HeyAlbert database [1], people at $1M+. A person is counted once per cause and can appear under several causes.
By metro
The New York metro has the most people with giving signals in our database (533), followed by the Bay Area (433) and Seattle (261) [1]. But the rate differs widely. In Los Angeles / Orange County, 208 of the 2,226 people in our set (about 9.3%) have a signal, and in Chicago about 7.0%, compared with about 3.3% in the Bay Area and about 1.9% in Seattle [1] (our calculation).
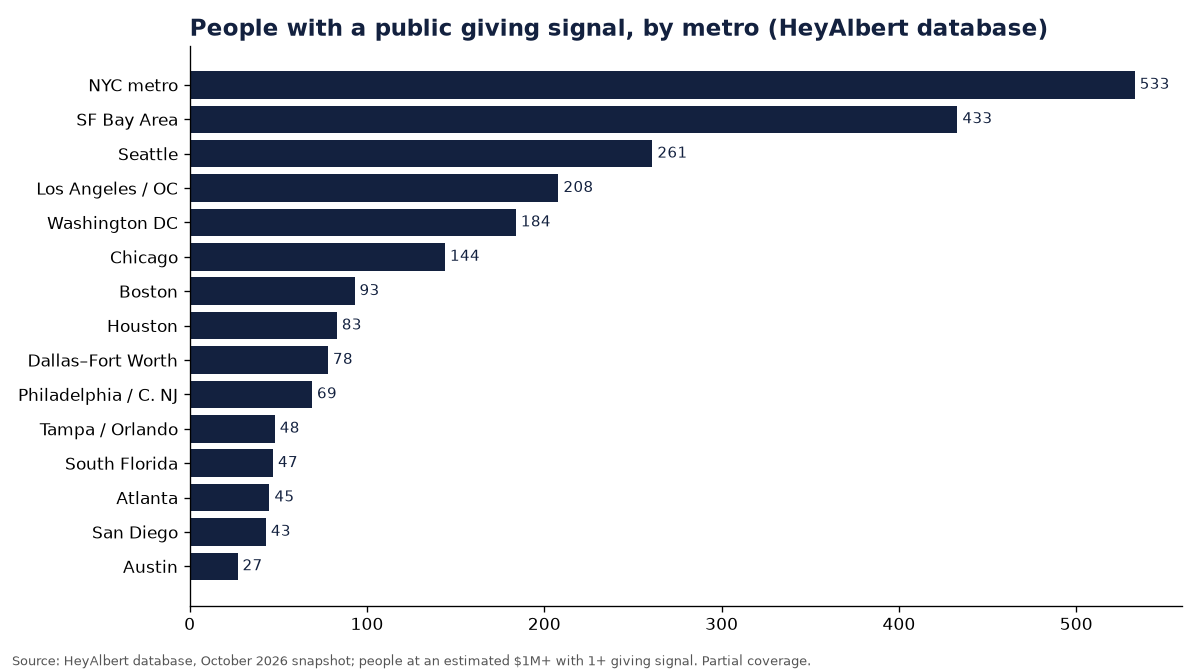
| Metro | People with a giving signal | People at $1M+ in our data | Share with a signal |
|---|---|---|---|
| NYC metro (incl. N. NJ, LI, Westchester) | 533 | 9,463 | 5.6% |
| SF Bay Area | 433 | 13,064 | 3.3% |
| Seattle | 261 | 13,768 | 1.9% |
| Los Angeles / OC | 208 | 2,226 | 9.3% |
| Washington DC | 184 | 4,742 | 3.9% |
| Chicago | 144 | 2,054 | 7.0% |
| Boston | 93 | 1,565 | 5.9% |
| Houston | 83 | 2,159 | 3.8% |
| Dallas–Fort Worth | 78 | 4,614 | 1.7% |
| Central NJ / Philadelphia | 69 | 3,105 | 2.2% |
| Tampa / Orlando | 48 | 1,365 | 3.5% |
| South Florida | 47 | 1,738 | 2.7% |
| Atlanta | 45 | 1,256 | 3.6% |
| San Diego | 43 | 764 | 5.6% |
| Austin | 27 | 1,538 | 1.8% |
Source: HeyAlbert database [1]. Metros with 25+ people with a signal. Shares are our calculation.
Those rates partly reflect our evidence. About 88% of our Seattle records rest on home values, and about a quarter of our Bay Area records rest on patents, evidence that often finds people earlier in their wealth-building, before board seats and named gifts [1]. In Los Angeles / Orange County, most records rest on executive roles, filings and gifts, and about 11% on physician records [1]. Chicago does not fit that pattern neatly, since about 70% of our Chicago records are home values [1]. So the rate is best read as a property of our data in each place, not a ranking of generosity.
Causes by metro
The cause mix also varies. Among classified causes, education leads in New York, the Bay Area, Seattle and Chicago. In Los Angeles / Orange County, health narrowly leads education (64 to 63), and New York has the largest number of people tied to arts and culture and to community and ethnic organizations (73 each) [1].
| Metro | Education | Human services | Health | Arts & culture | Community & ethnic | Other |
|---|---|---|---|---|---|---|
| NYC metro | 142 | 110 | 53 | 73 | 73 | 160 |
| SF Bay Area | 145 | 72 | 48 | 54 | <25 | 143 |
| Seattle | 72 | 51 | 40 | 39 | 48 | 40 |
| Los Angeles / OC | 63 | 44 | 64 | <25 | <25 | 47 |
| Washington DC | 53 | 31 | <25 | <25 | <25 | 72 |
| Chicago | 41 | <25 | <25 | 27 | <25 | 46 |
| Boston | <25 | <25 | <25 | <25 | <25 | <25 |
Source: HeyAlbert database [1]. The seven metros with the most giving signals. Cells under 25 shown as <25.
What it means for fundraisers
For university advancement offices, hospital foundations and community organizations, the useful takeaway is that most Indian-American families at $1M+ in our data have no public giving signal at all. That is not the same as not giving: much giving happens through donor-advised funds, temples and community organizations that do not publish donor rolls. It does mean that the families with a visible record are a small, heavily solicited group, and that prospect research which stops at donor rolls misses most of the market.
Methodology
Giving signals come from public sources such as nonprofit annual reports and donor rolls, IRS Form 990 filings that list officers and directors, and private-foundation filings. Each signal is attached to a person in our database with the source URL it came from. Cause areas are assigned from the organization. Our metro regions are our own groupings of cities. HeyAlbert counts are aggregates from our database as of October 2026. They include people we identified as likely of Indian origin with an estimated net worth of $1M or more, based on public records such as property assessments, professional licenses, patents, SEC filings and donor rolls. Coverage is partial and uneven across places, because it depends on which public records exist and which we have processed. These are counts of people in our database, not population totals. Any cell under 25 is suppressed, and we publish aggregates only, never individual records.
Related research
- Where do wealthy Indian Americans give their money?
- Are wealthy Indian Americans setting up private foundations and donor-advised funds?
- What are the largest gifts by Indian Americans to US universities?
HeyAlbert finds Indian-American families worth $1M+ and tells you who to call, with every fact cited. Explore the people behind these totals at heyalbert.site.
Sources
- HeyAlbert database, aggregate counts (October 2026 snapshot); how we build it is described on our methodology page. HeyAlbert. https://heyalbert.site/research/methodology/
See the data before you talk to us
Read a full sample report to judge the depth and sourcing, then book a walkthrough with your own use case.