
Insight
Indian-American physicians by state and specialty: our $1M+ data
Our database counts 7,181 senior Indian-American physicians at an estimated $1M+. Cardiology leads, and smaller states punch far above their size.
Medicine is one of the best-documented routes to wealth in the Indian-American community. Our research on Indian-American doctors estimates, from Federation of State Medical Boards figures, that graduates of Indian medical schools are roughly 4.8% of all licensed US physicians, before counting the many US-trained doctors of Indian heritage [3].
This post looks at a specific slice: the 7,181 senior Indian-American physicians in the HeyAlbert database whose estimated net worth of $1M+ rests on their medical career [1]. Where do they practice, in which specialties, and how long have they been in practice?
How we identify them
These estimates start from public federal records: the National Provider Identifier (NPI) registry, which lists each provider's specialty and practice location, and Medicare enrollment [1]. We include physicians in higher-earning specialties with 20 or more years since medical school, and we estimate $1M+ from that seniority and specialty. That estimate is a rule of thumb, not a verified balance sheet, and every one of these physicians is placed in our $1M–5M band [1]. Because the starting records are national, this slice is more evenly covered across states than our property-based counts.
By state
California (767), Texas (691), New York (584) and Florida (519) have the most physicians in this set [1]. Relative to each state's Asian Indian population, the picture changes: smaller states with fewer Indian-American residents overall show many more senior physicians per resident [1][2] (our calculation). West Virginia, Kentucky, Louisiana and Alabama all show more than 35 physicians in our set per 10,000 Asian Indian residents, while California shows about 8 and Washington about 7 [1][2].
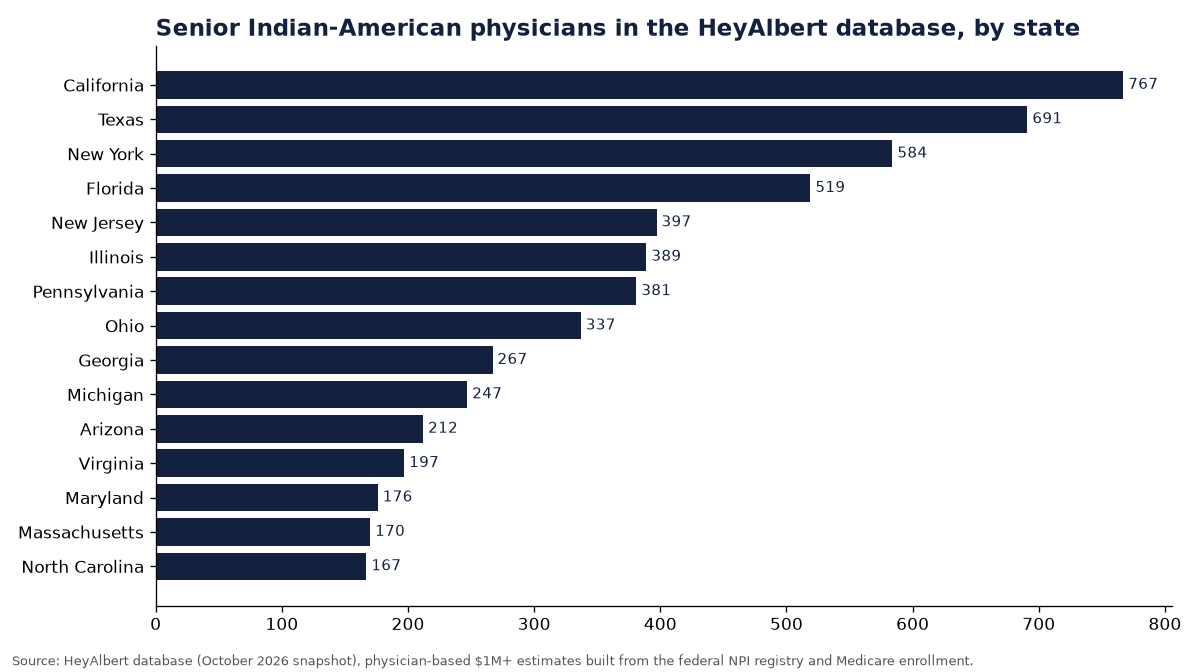
| State | Physicians in our $1M+ set | Asian Indian residents, 2020–2024 | Physicians per 10,000 Asian Indian residents |
|---|---|---|---|
| California | 767 | 967,504 | 7.9 |
| Texas | 691 | 588,500 | 11.7 |
| New York | 584 | 417,890 | 14.0 |
| Florida | 519 | 231,340 | 22.4 |
| New Jersey | 397 | 448,645 | 8.8 |
| Illinois | 389 | 280,737 | 13.9 |
| Pennsylvania | 381 | 173,014 | 22.0 |
| Ohio | 337 | 111,815 | 30.1 |
| Georgia | 267 | 191,013 | 14.0 |
| Michigan | 247 | 138,644 | 17.8 |
| Arizona | 212 | 75,273 | 28.2 |
| Virginia | 197 | 174,842 | 11.3 |
| Maryland | 176 | 116,946 | 15.0 |
| Massachusetts | 170 | 144,091 | 11.8 |
| North Carolina | 167 | 142,203 | 11.7 |
| Indiana | 146 | 60,358 | 24.2 |
| Washington | 117 | 172,827 | 6.8 |
| Wisconsin | 112 | 39,669 | 28.2 |
| Missouri | 107 | 41,272 | 25.9 |
| Tennessee | 98 | 43,949 | 22.3 |
| Minnesota | 98 | 52,192 | 18.8 |
| Connecticut | 94 | 67,991 | 13.8 |
| Kentucky | 92 | 19,937 | 46.1 |
| Louisiana | 66 | 15,191 | 43.4 |
| Alabama | 64 | 18,026 | 35.5 |
| Colorado | 56 | 43,100 | 13.0 |
| South Carolina | 55 | 33,760 | 16.3 |
| Oklahoma | 54 | 18,935 | 28.5 |
| Oregon | 48 | 36,193 | 13.3 |
| West Virginia | 47 | 4,440 | 105.9 |
| Kansas | 47 | 21,969 | 21.4 |
| Iowa | 46 | 18,282 | 25.2 |
| District of Columbia | 40 | 10,473 | 38.2 |
| Nevada | 40 | 22,037 | 18.2 |
| Arkansas | 34 | 15,000 | 22.7 |
| Delaware | 33 | 18,531 | 17.8 |
| Mississippi | 26 | 7,887 | 33.0 |
| Nebraska | 25 | 10,753 | 23.2 |
Sources: HeyAlbert database [1]; ACS 2020–2024 5-year Table B02018 [2]. States with 25+ physicians in our set. The ratio is our calculation and compares a subset of our database with a population total, so read it as a pattern, not a rate.
Part of the explanation is the denominator. California's and Washington's Indian-American communities are large and dominated by engineers and tech workers, so physicians are a smaller share of them. In smaller states, a senior physician and their family can be a meaningful share of the whole local community, which is worth remembering for anyone doing outreach there.
By specialty
Cardiology is the largest specialty in this set, with 966 physicians, followed by diagnostic radiology (751), anesthesiology (735), gastroenterology (652) and nephrology (616) [1]. Internal-medicine subspecialties dominate the list, which reflects both our selection of higher-earning specialties and the training paths many Indian-trained doctors took into US residency programs.
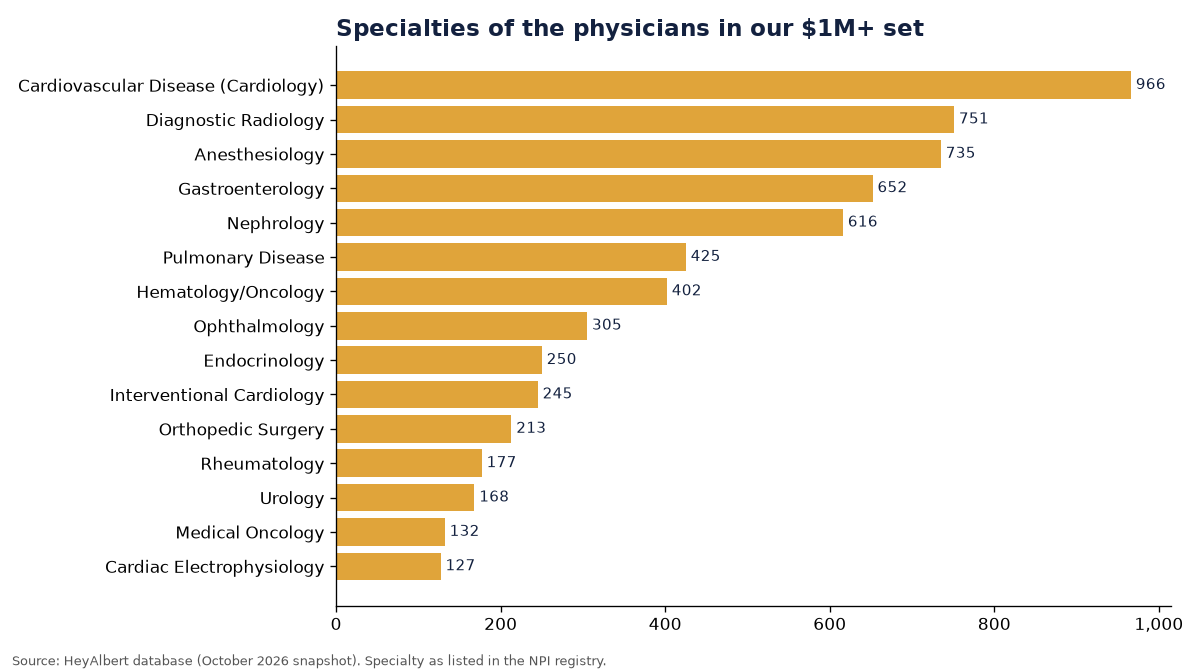
| Specialty (NPI listing) | Physicians |
|---|---|
| Cardiovascular Disease (Cardiology) | 966 |
| Diagnostic Radiology | 751 |
| Anesthesiology | 735 |
| Gastroenterology | 652 |
| Nephrology | 616 |
| Pulmonary Disease | 425 |
| Hematology/Oncology | 402 |
| Ophthalmology | 305 |
| Endocrinology | 250 |
| Interventional Cardiology | 245 |
| Orthopedic Surgery | 213 |
| Rheumatology | 177 |
| Urology | 168 |
| Medical Oncology | 132 |
| Cardiac Electrophysiology | 127 |
| Radiation Oncology | 124 |
| Allergy/Immunology | 123 |
| Otolaryngology | 118 |
| Neurosurgery | 92 |
| Dermatology | 88 |
Source: HeyAlbert database [1]. The 20 largest specialties in the set.
By year of medical school graduation
Most physicians in this set graduated in the 1990s (2,599) or between 2000 and 2005 (2,598), with 1,314 from the 1980s [1]. That makes it a group largely in its late forties to sixties: at peak earnings, often owning or buying into practices, and starting to think about succession, retirement income and estate planning.
| Medical school class | Physicians |
|---|---|
| 1960s or earlier | 95 |
| 1970s | 567 |
| 1980s | 1,314 |
| 1990s | 2,599 |
| 2000–2005 | 2,598 |
Source: HeyAlbert database [1]. Graduation year as listed in public records; the 1950s and 1960s are combined because the 1950s cell is under 25.
What it means
Senior physicians are among the most reachable high-net-worth Indian Americans: their specialty and practice location are public, and their planning needs are well understood. For advisors, the opportunity is broadest outside the big coastal metros, in states like Ohio, Pennsylvania, Florida and across the South and Midwest, where these doctors are a large share of the community's established wealth. Our state posts for Ohio and Michigan show how central physicians are in those states.
Methodology
Physician records come from the NPI registry published by the Centers for Medicare & Medicaid Services [4], with Medicare enrollment status [1]. Origin is inferred from names and other public evidence, which can be wrong for individuals; we publish aggregates only. State is the practice location listed in the registry, which may differ from where the physician lives. Population figures are ACS 2020–2024 5-year estimates, Table B02018, “Asian Indian, alone or in any combination” [2]. Cells under 25 are suppressed. These are counts of people in our database, not totals of Indian-American physicians.
Related research
HeyAlbert finds Indian-American families worth $1M+ and tells you who to call, with every fact cited. Explore the people behind these totals at heyalbert.site.
Sources
- HeyAlbert database, aggregate counts (October 2026 snapshot), physician estimates built from the NPI registry. HeyAlbert. https://heyalbert.site/research/methodology/
- ACS 2020–2024 5-year estimates, Table B02018, all states. US Census Bureau. https://data.census.gov/table/ACSDT5Y2024.B02018?g=010XX00US$0400000 (data: machine-readable)
- HeyAlbert Research: How many US doctors are of Indian origin? (citing the Federation of State Medical Boards). HeyAlbert. https://heyalbert.site/research/indian-american-doctors-physicians/
- NPPES NPI Registry. Centers for Medicare & Medicaid Services. https://npiregistry.cms.hhs.gov/
See the data before you talk to us
Read a full sample report to judge the depth and sourcing, then book a walkthrough with your own use case.