
Short answer
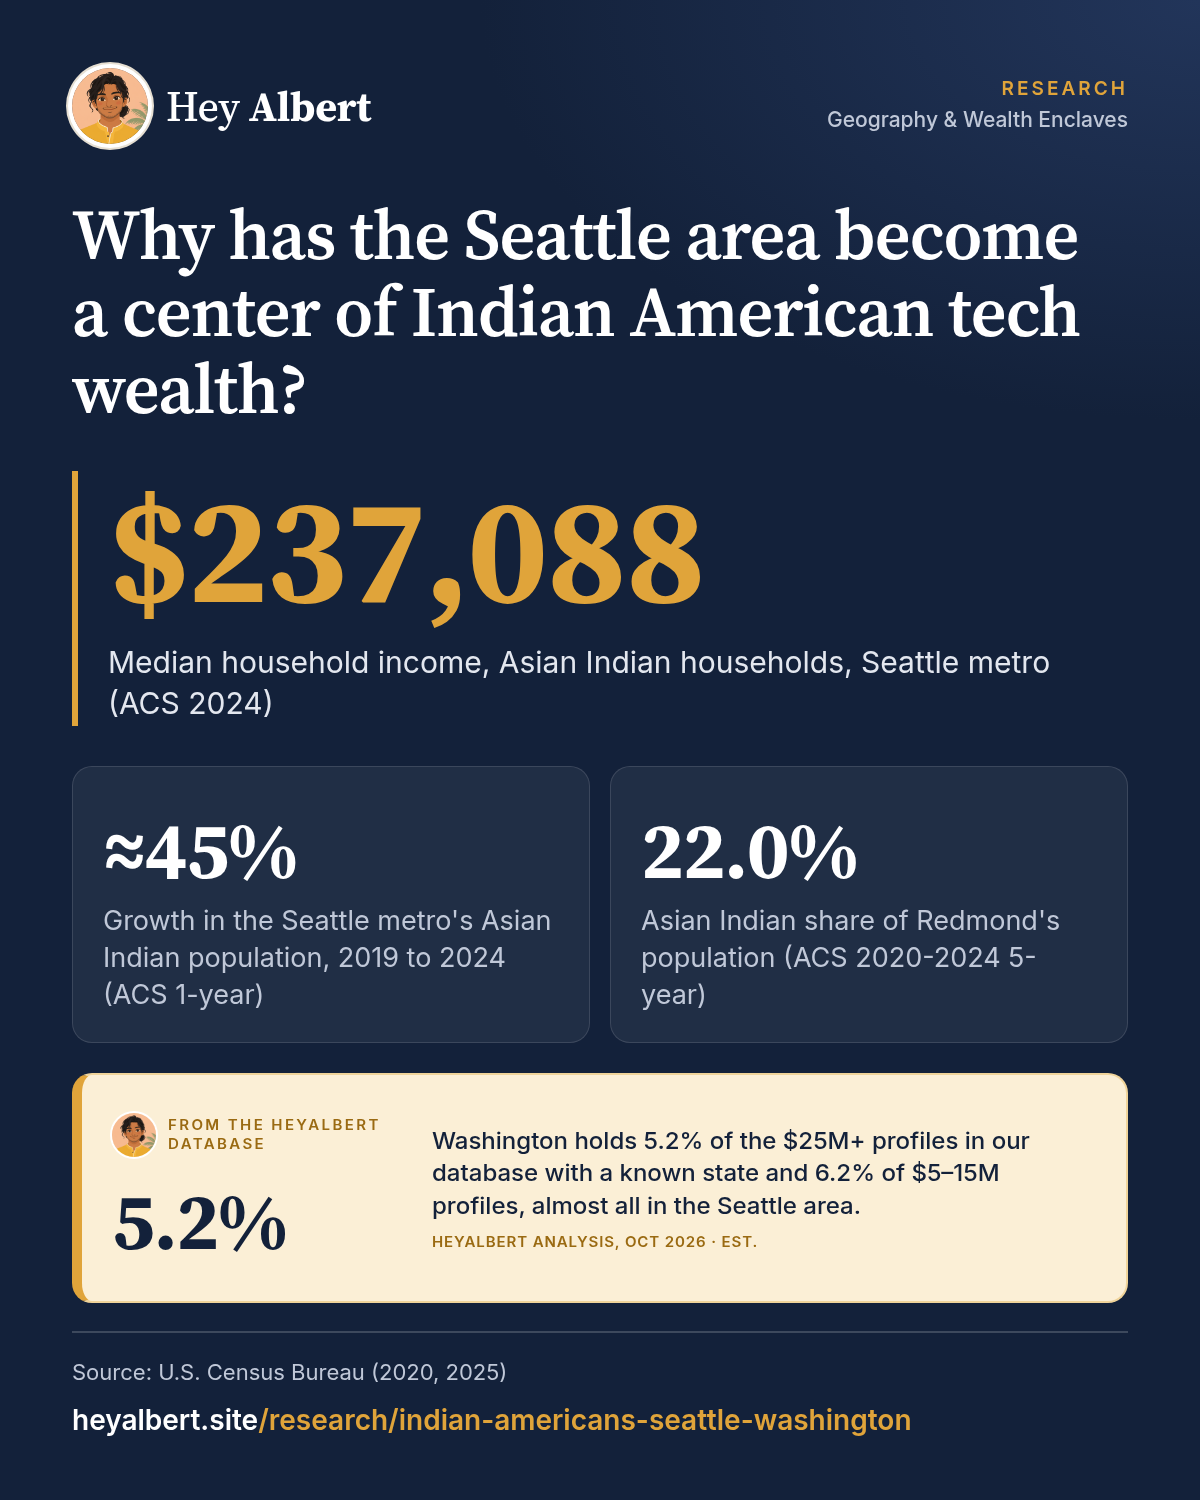
The Seattle metro area had 172,407 Asian Indian residents in 2024, up roughly 45% from 2019, and their median household income of $237,088 was the highest of any metro outside the Bay Area1,2. The growth follows the region's technology employers: 12.1% of employed Asian Indians in the metro work in the information sector and 35.7% in professional, scientific and management services1. Washington's Asian Indian households had a median income of $230,380, the highest of any state the Census Bureau publishes3.
HeyAlbert data shows Washington holds 5.2% of the $25M+ profiles in our database with a known state and 6.2% of $5–15M profiles, almost all in the Seattle area. See the data · Methodology
The numbers
In 2024 the Seattle-Tacoma-Bellevue metro area had 172,407 residents who identified as Asian Indian alone, 4.2% of the metro population1,6. Their median household income was $237,088, against $112,388 for all metro households1,6. Only the San Jose and San Francisco metros, where Asian Indian medians exceed the Census Bureau's $250,000 reporting ceiling, rank higher1.
Statewide, Washington had 187,700 Asian Indian residents and a median Asian Indian household income of $230,380, the highest of the 17 states the ACS publishes for this group3. See how Washington compares in our state ranking.
What HeyAlbert data shows
Growth: one of the fastest in the country
The metro's Asian Indian population rose from about 118,800 in 2019 to 172,400 in 2024, roughly 45%, our calculation from ACS 1-year estimates1,2. Washington state grew about 48% over the same period, second only to North Carolina among published states3,7. King County's Asian Indian population went from 96,201 to 127,9405,8.
The community is young and recently arrived: the median age of Asian Indians in the metro is 34.0, and about 75% were born abroad (128,741 of 172,407)1. That profile fits a workforce recruited into technology jobs over the past decade or so. Our post on H-1B visas and Indian American wealth covers the immigration pathway.
The tech employer effect
The Seattle area is home to the headquarters of Microsoft, in Redmond, and Amazon, in Seattle, along with large engineering offices of many other technology companies. The ACS shows how closely the Asian Indian community is tied to that sector: 12.1% of employed Asian Indians in the metro work in the information industry, more than six times the 1.8% share for all US workers, and 35.7% work in professional, scientific and management services1,9.
Immigration data point the same way. US Citizenship and Immigration Services reports that 70% of H-1B petitions approved in fiscal 2025 were for people born in India and that computer-related occupations made up 62% of approvals10. Large technology employers are among the biggest H-1B sponsors, so the visa system channels Indian engineers to places like Seattle. For how tech careers turn into wealth, see equity compensation for Indian American tech executives.
Where they live: the Eastside
Within the region, the Asian Indian population is concentrated on the Eastside, near the major tech campuses. Census 2020-2024 five-year estimates show4:
| Place | Asian Indian residents | Share of population |
|---|---|---|
| Seattle | 24,644 | 3.3% |
| Bellevue | 21,090 | 13.9% |
| Redmond | 16,997 | 22.0% |
| Sammamish | 11,969 | 18.0% |
| Bothell East (CDP) | 4,202 | 28.8% |
Shares are our calculation against total population; estimates carry margins of error of several hundred to about 1,700 people4.
Income, education and housing
Seattle's Asian Indian community is among the most educated in the country. In the metro, 87.8% of adults 25 and older hold at least a bachelor's degree and 57.0% a graduate or professional degree1. In King County, per capita income was $124,976, nearly matching Santa Clara County's $125,6435. Only 2.0% of the metro's Asian Indian residents lived below the poverty line1.
Housing is expensive and many households rent. The median home value for Asian Indian homeowners was $1,080,600 in the metro and $1,147,500 in King County, and the King County homeownership rate was 48.6%1,5. For a young, high-earning population, that points to rising home purchases and wealth accumulation as households settle. Washington does not tax wage income, which raises take-home pay for salaried workers. It does tax long-term capital gains from assets such as stocks and business interests: the 2021 law created a 7% tax that applies above an annual standard deduction, set at $278,000 for 2025, according to the state Department of Revenue11. That matters for tech employees who sell company stock, a topic in our analysis of tax-driven moves.
Seattle versus Silicon Valley
Seattle's Asian Indian community is smaller than the Bay Area's, about 172,000 people against about 482,000 across the San Francisco and San Jose metros, but it is growing faster1,2. The Bay Area added roughly 72,000 Asian Indian residents between 2019 and 2024; Seattle added roughly 54,000 on a much smaller base1,2. For the comparison, see our Silicon Valley analysis and the full metro ranking. For the executive side of the story, see why so many tech CEOs are Indian American.
Frequently asked questions
How many Indian Americans live in the Seattle area?
About 172,000 people identified as Asian Indian alone in the Seattle-Tacoma-Bellevue metro area in 2024, up roughly 45% from 2019.
What is the median income of Indian Americans in Seattle?
About $237,000 for Asian Indian households in the Seattle metro in 2024, more than twice the metro-wide median of about $112,000.
Which Seattle suburbs have the most Indian Americans?
Bellevue, Redmond and Sammamish on the Eastside. Asian Indians make up about 22% of Redmond and 18% of Sammamish, according to 2020-2024 Census estimates.
Why are so many Indian Americans moving to Seattle?
Mainly technology jobs. The region hosts major tech headquarters and engineering offices, and a large share of the metro's Asian Indian workforce is employed in the information and professional services sectors.
Sources
Figures are from the public sources below, with the data year stated. Estimates are labeled as estimates. Accessed October 24, 2026.
- US Census Bureau, S0201 Selected Population Profile, Asian Indian alone, by metro area (ACS 2024 1-year) (2025). data.census.gov ↩ ↩ ↩
- US Census Bureau, S0201 Selected Population Profile, Asian Indian alone, by metro area (ACS 2019 1-year) (2020). data.census.gov ↩ ↩ ↩
- US Census Bureau, S0201 Selected Population Profile, Asian Indian alone, by state (ACS 2024 1-year) (2025). data.census.gov ↩ ↩ ↩
- US Census Bureau, B02015 Asian Alone by Selected Groups and B01003 Total Population, Washington places (ACS 2020-2024 5-year) (2025). data.census.gov ↩ ↩ ↩
- US Census Bureau, S0201 Selected Population Profile, Asian Indian alone, by county (ACS 2024 1-year) (2025). data.census.gov ↩ ↩ ↩
- US Census Bureau, S0201 Selected Population Profile, total population, by metro area (ACS 2024 1-year) (2025). data.census.gov ↩ ↩
- US Census Bureau, S0201 Selected Population Profile, Asian Indian alone, by state (ACS 2019 1-year) (2020). data.census.gov ↩
- US Census Bureau, S0201 Selected Population Profile, Asian Indian alone, by county (ACS 2019 1-year) (2020). data.census.gov ↩
- US Census Bureau, S0201 Selected Population Profile, total population, United States (ACS 2024 1-year) (2025). data.census.gov ↩
- US Citizenship and Immigration Services, Characteristics of H-1B Specialty Occupation Workers, Fiscal Year 2025 (2026). uscis.gov ↩
- Washington State Department of Revenue, Capital gains tax (2026). dor.wa.gov ↩