
Insight
Indian-American wealth by metro: population vs. millionaires
New York has the most Indian-American residents. In our database, the Bay Area has the most people at $25M+. Here are 15 metros side by side.
Ask where Indian Americans live and the answer is a population ranking: New York first by a wide margin, then Dallas–Fort Worth, San Francisco–Oakland, Chicago and San Jose [1]. Ask where the largest Indian-American fortunes are concentrated and the ranking changes. This post puts the Census Bureau's metro population figures beside our own counts of people in the HeyAlbert database at an estimated $1M+, $5M+ and $25M+.
The headline: the combined San Francisco Bay Area has about 478,000 residents of Asian Indian descent, roughly two-thirds of New York's 737,160, yet it has more people in our database at $25M+ than the New York metro does [1][4].
The population ranking
The American Community Survey's 2020–2024 estimates count 737,160 people of Asian Indian descent, alone or in combination, in the New York–Newark–Jersey City metro area, followed by Dallas–Fort Worth (286,619) and San Francisco–Oakland–Fremont (269,131) [1]. Growth since the 2015–2019 survey was fastest in Austin (about 50%), Dallas–Fort Worth (about 47%) and Seattle (about 41%), and slowest in Los Angeles (about 2%) and New York (about 7%) [1][2] (our calculation).
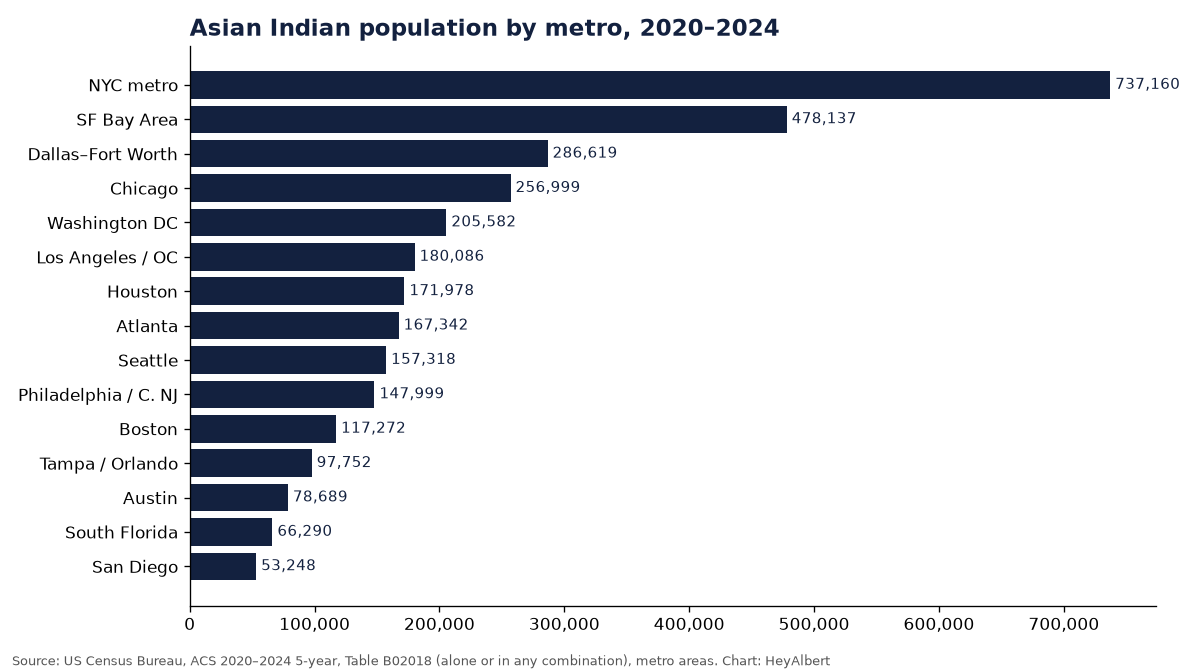
| HeyAlbert metro | Census metro area(s) | Asian Indian, 2020–2024 | Change since 2015–19 | Share of metro |
|---|---|---|---|---|
| NYC metro (incl. N. NJ, LI, Westchester) | New York-Newark-Jersey City, NY-NJ | 737,160 | 7% | 3.7% |
| SF Bay Area | San Francisco-Oakland-Fremont, CA + San Jose-Sunnyvale-Santa Clara, CA | 478,137 | 17% | 7.2% |
| Dallas–Fort Worth | Dallas-Fort Worth-Arlington, TX | 286,619 | 47% | 3.6% |
| Chicago | Chicago-Naperville-Elgin, IL-IN | 256,999 | 9% | 2.7% |
| Washington DC | Washington-Arlington-Alexandria, DC-VA-MD-WV | 205,582 | 11% | 3.3% |
| Los Angeles / OC | Los Angeles-Long Beach-Anaheim, CA | 180,086 | 2% | 1.4% |
| Houston | Houston-Pasadena-The Woodlands, TX | 171,978 | 12% | 2.3% |
| Atlanta | Atlanta-Sandy Springs-Roswell, GA | 167,342 | 26% | 2.7% |
| Seattle | Seattle-Tacoma-Bellevue, WA | 157,318 | 41% | 3.9% |
| Central NJ / Philadelphia | Philadelphia-Camden-Wilmington, PA-NJ-DE-MD | 147,999 | 10% | 2.4% |
| Boston | Boston-Cambridge-Newton, MA-NH | 117,272 | 19% | 2.4% |
| Tampa / Orlando | Tampa-St. Petersburg-Clearwater, FL + Orlando-Kissimmee-Sanford, FL | 97,752 | 25% | 1.6% |
| Austin | Austin-Round Rock-San Marcos, TX | 78,689 | 50% | 3.2% |
| South Florida | Miami-Fort Lauderdale-West Palm Beach, FL | 66,290 | 18% | 1.1% |
| San Diego | San Diego-Chula Vista-Carlsbad, CA | 53,248 | 23% | 1.6% |
Sources: ACS 5-year estimates, Table B02018 (2020–2024 and 2015–2019) and Table B01003 (2020–2024) [1][2][3]. Change and share are our calculations. The Bay Area combines the San Francisco–Oakland–Fremont and San Jose–Sunnyvale–Santa Clara metros, and Tampa / Orlando combines those two metros. Our “Central NJ / Philadelphia” region is compared with the Census Philadelphia metro; central New Jersey counties such as Middlesex are inside the Census New York metro, so the two regions do not line up exactly.
The wealth ranking in our database
In our database, the Bay Area leads every upper tier: 13,064 people at $1M+, 8,153 at $5M+ and 1,042 at $25M+ [4]. The New York metro is second at $25M+ with 815, then Seattle (261), Los Angeles / Orange County (252) and Dallas–Fort Worth (215) [4]. South Florida stands out for its size: its Census population is the smallest in this table apart from San Diego, but it has 188 people in our database at $25M+ [1][4].
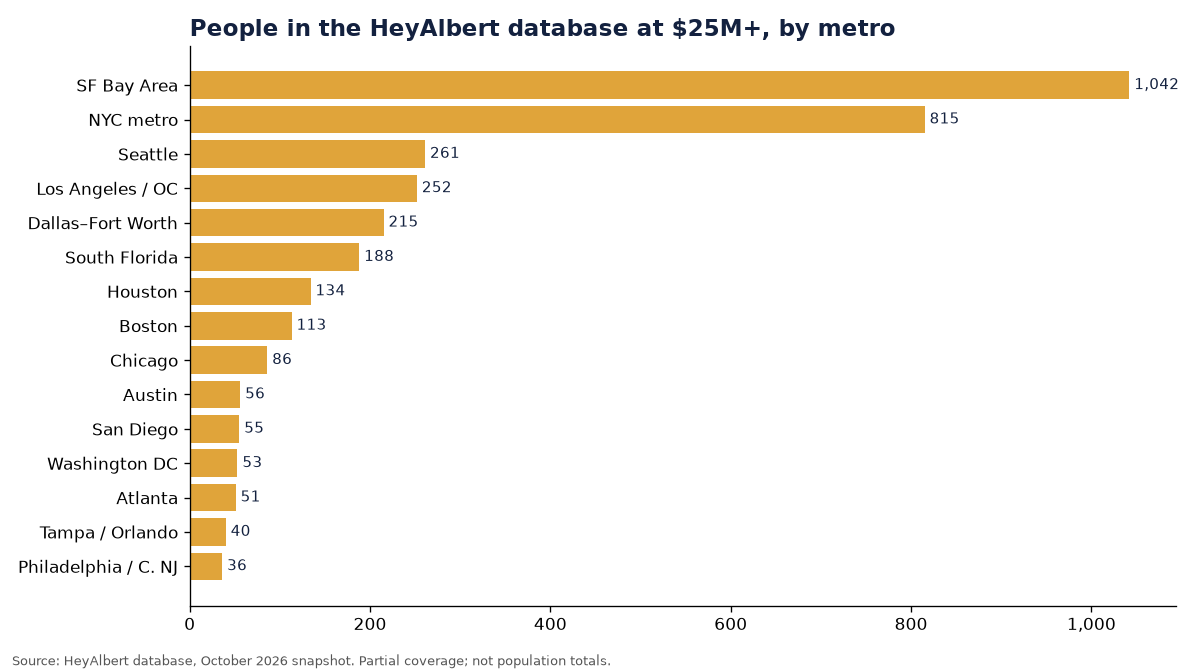
| HeyAlbert metro | $1M+ | $5M+ | $25M+ | $5M+ share |
|---|---|---|---|---|
| SF Bay Area | 13,064 | 8,153 | 1,042 | 62% |
| NYC metro (incl. N. NJ, LI, Westchester) | 9,463 | 3,035 | 815 | 32% |
| Seattle | 13,768 | 1,344 | 261 | 10% |
| Los Angeles / OC | 2,226 | 1,220 | 252 | 55% |
| Dallas–Fort Worth | 4,614 | 574 | 215 | 12% |
| South Florida | 1,738 | 431 | 188 | 25% |
| Houston | 2,159 | 336 | 134 | 16% |
| Boston | 1,565 | 376 | 113 | 24% |
| Chicago | 2,054 | 309 | 86 | 15% |
| Austin | 1,538 | 205 | 56 | 13% |
| San Diego | 764 | 274 | 55 | 36% |
| Washington DC | 4,742 | 225 | 53 | 5% |
| Atlanta | 1,256 | 182 | 51 | 14% |
| Tampa / Orlando | 1,365 | 158 | 40 | 12% |
| Central NJ / Philadelphia | 3,105 | 177 | 36 | 6% |
Source: HeyAlbert database [4]. Counts of people in our database, not population totals. Our metro regions are our own groupings of cities and differ from Census metro boundaries.
Why the two rankings diverge
Three things drive the gap. First, the kind of wealth: the Bay Area's upper tier is founders, early employees and executives with equity, and Los Angeles / Orange County shows a high $5M+ share (55%) in our data too [4]. Second, the evidence we hold: in Seattle and Washington DC, most of our records come from home values, which identify many people in the $1M–5M band and relatively few above it; Washington DC has 4,742 people in our set but only 5% in the $5M+ bands [4]. Third, coverage: we have processed more public records in some regions than others, so a metro's absolute count says as much about our sources as about its families.
That is why we do not divide our counts by population to produce a “millionaire rate.” The comparison that holds up is within our own data: the mix of bands in each metro, and how that mix differs from the population picture.
What it means for outreach
Population size is a poor guide to where high-net-worth Indian-American families are. Dallas–Fort Worth and Chicago are larger communities than the Bay Area's San Jose half, but our $25M+ counts there are a fraction of the Bay Area's. South Florida and Los Angeles punch above their population weight. For advisors, nonprofits and luxury brands, the right market list depends on which tier you serve. Our state-by-state posts, such as California, Texas and New York, go a level deeper.
Methodology
Census figures are ACS 5-year estimates (2020–2024 and 2015–2019), Table B02018, “Asian Indian, alone or in any combination,” for Census metropolitan statistical areas [1][2], with total population from Table B01003 [3]. The Census Bureau changed how it codes detailed race responses in 2020, so part of the change may reflect coding. Estimates carry margins of error.
HeyAlbert counts are aggregates from our database as of October 2026. They include people we identified as likely of Indian origin with an estimated net worth of $1M or more, based on public records such as property assessments, professional licenses, patents, SEC filings and donor rolls. Coverage is partial and uneven across places, because it depends on which public records exist and which we have processed. These are counts of people in our database, not population totals. Any cell under 25 is suppressed, and we publish aggregates only, never individual records.
Related research
- Which US metro areas have the most affluent Indian American communities?
- How many Indian American millionaires and billionaires are there?
HeyAlbert finds Indian-American families worth $1M+ and tells you who to call, with every fact cited. Explore the people behind these totals at heyalbert.site.
Sources
- ACS 2020–2024 5-year estimates, Table B02018, all metropolitan statistical areas. US Census Bureau. https://data.census.gov/table/ACSDT5Y2024.B02018?g=010XX00US$3100000 (data: machine-readable)
- ACS 2015–2019 5-year estimates, Table B02018, all metropolitan statistical areas. US Census Bureau. https://data.census.gov/table/ACSDT5Y2019.B02018?g=010XX00US$3100000 (data: machine-readable)
- ACS 2020–2024 5-year estimates, Table B01003 (total population), all metropolitan statistical areas. US Census Bureau. https://data.census.gov/table/ACSDT5Y2024.B01003?g=010XX00US$3100000 (data: machine-readable)
- HeyAlbert database, aggregate counts (October 2026 snapshot); how we build it is described on our methodology page. HeyAlbert. https://heyalbert.site/research/methodology/
See the data before you talk to us
Read a full sample report to judge the depth and sourcing, then book a walkthrough with your own use case.