
Insight
Indian-American wealth in the New York metro: the center has moved to New Jersey
The New York metro has 737,160 residents of Asian Indian descent. Middlesex County, NJ now outnumbers Queens, while Manhattan holds our top tier.
The New York–Newark–Jersey City metro area is home to 737,160 people of Asian Indian descent, about one in seven Indian Americans nationwide [1]. It is by far the largest Indian-American community of any US metro (our ranking of metro areas), and it grew about 7% between the 2015–2019 and 2020–2024 surveys [1][2].
Inside that total, the balance has shifted. The metro's largest Indian-American county is no longer in New York City at all, and our own data shows a third geography, distinct from both, where the highest net worth concentrates.
- 737,160 residents of Asian Indian descent (alone or in combination) in the New York metro, 2020–2024 average [1], or 3.7% of the population [3].
- +6.9% versus the 2015–2019 estimate of 689,507 [1][2] (our calculation).
- 9,463 people in the HeyAlbert database placed in the New York metro at an estimated $1M+, of whom 3,035 are in our $5M+ bands [9].
Where the New York metro's Indian-American residents live, by county
The Census Bureau's American Community Survey counts 737,160 people who report Asian Indian ancestry, alone or with another group, in the New York metro [1]. Middlesex County, NJ holds 20% of them, and the three largest counties together hold 47% [4][5] (our calculation).
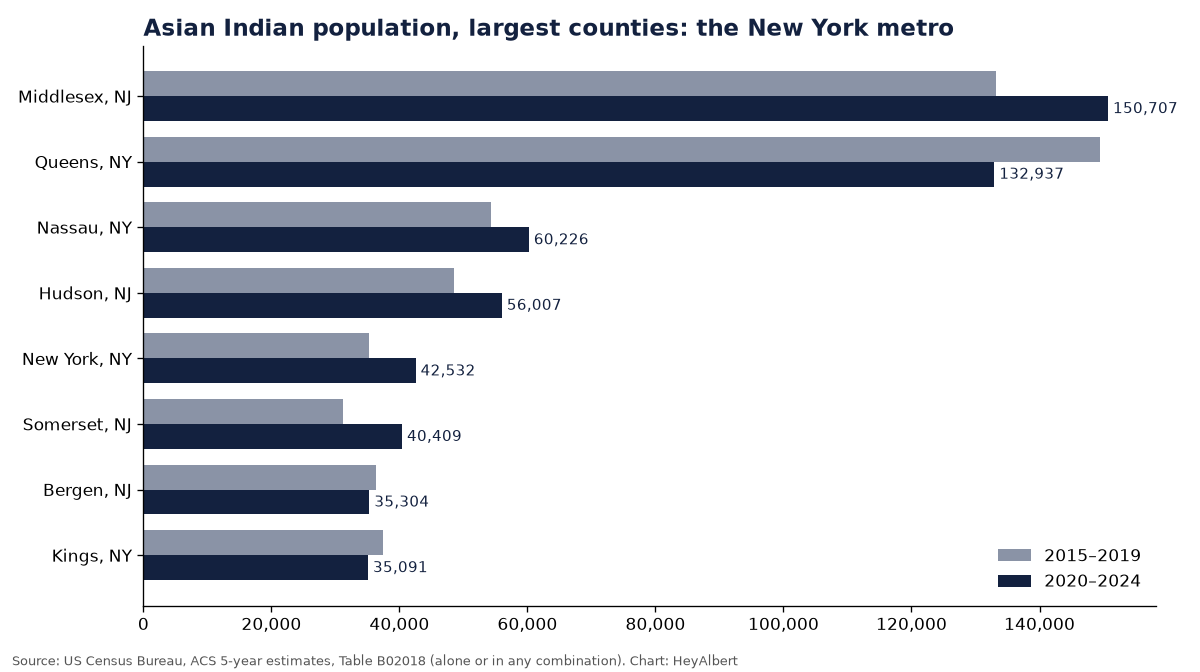
| County | 2020–2024 | 2015–2019 | Change | Share of county |
|---|---|---|---|---|
| Middlesex County, NJ | 150,707 | 133,139 | 13% | 17.3% |
| Queens County, NY | 132,937 | 149,507 | -11% | 5.7% |
| Nassau County, NY | 60,226 | 54,376 | 11% | 4.3% |
| Hudson County, NJ | 56,007 | 48,570 | 15% | 7.8% |
| New York County, NY | 42,532 | 35,317 | 20% | 2.6% |
| Somerset County, NJ | 40,409 | 31,230 | 29% | 11.6% |
| Bergen County, NJ | 35,304 | 36,301 | -3% | 3.7% |
| Kings County, NY | 35,091 | 37,375 | -6% | 1.3% |
| Morris County, NJ | 31,460 | 27,804 | 13% | 6.1% |
| Suffolk County, NY | 22,860 | 19,441 | 18% | 1.5% |
Asian Indian alone or in any combination. Sources: ACS 5-year estimates [4][5]; totals from Table B01003. Change and share are our calculations. Estimates carry margins of error.
Middlesex County, New Jersey, now has about 150,700 residents of Asian Indian descent, more than Queens, which fell about 11% to about 132,900 [4][5]. Somerset County grew about 29% and Manhattan (New York County) about 20%, while Bergen and Brooklyn edged down [4][5]. The most concentrated larger places are all suburban: Parsippany at about 32%, Secaucus at 24% and Hicksville on Long Island at 17% [7].
The most concentrated communities
Raw counts favor big cities. Ranking places of 20,000+ residents by the share who report Asian Indian ancestry gives a different map [7][8]:
| Place | Asian Indian residents | Total population | Share |
|---|---|---|---|
| Parsippany CDP | 6,868 | 21,345 | 32.2% |
| Secaucus | 5,302 | 21,778 | 24.3% |
| Carteret | 4,778 | 25,496 | 18.7% |
| Hicksville CDP | 7,575 | 43,780 | 17.3% |
| Woodbridge CDP | 3,082 | 20,756 | 14.8% |
| Somerset CDP | 3,318 | 22,720 | 14.6% |
| Hillsborough CDP | 3,020 | 22,585 | 13.4% |
| Jersey City | 37,794 | 294,078 | 12.9% |
Places with 20,000+ residents and at least 1,000 Asian Indian residents. CDP = census-designated place. Sources: ACS 2020–2024 5-year, Tables B02018 and B01003 [7][8]; shares are our calculation.
What the HeyAlbert database shows in the New York metro
HeyAlbert builds profiles of Indian-American individuals with an estimated net worth of $1M or more from public records, and every estimate is tied to a cited source. Our database currently places 9,463 such people in the New York metro [9]. That is a count of people we have found and estimated, not a census of wealthy households: our coverage is partial and uneven.
| Estimated net-worth band | People in our database |
|---|---|
| $1M–5M | 6,428 |
| $5M–15M | 2,220 |
| $25M+ (probable) | 278 |
| $25M+ (likely) | 537 |
| Total, $1M+ | 9,463 |
Source: HeyAlbert database [9]. Bands are estimates from public evidence; “likely” and “probable” describe our confidence in the $25M+ tier. Cells under 25 are suppressed.
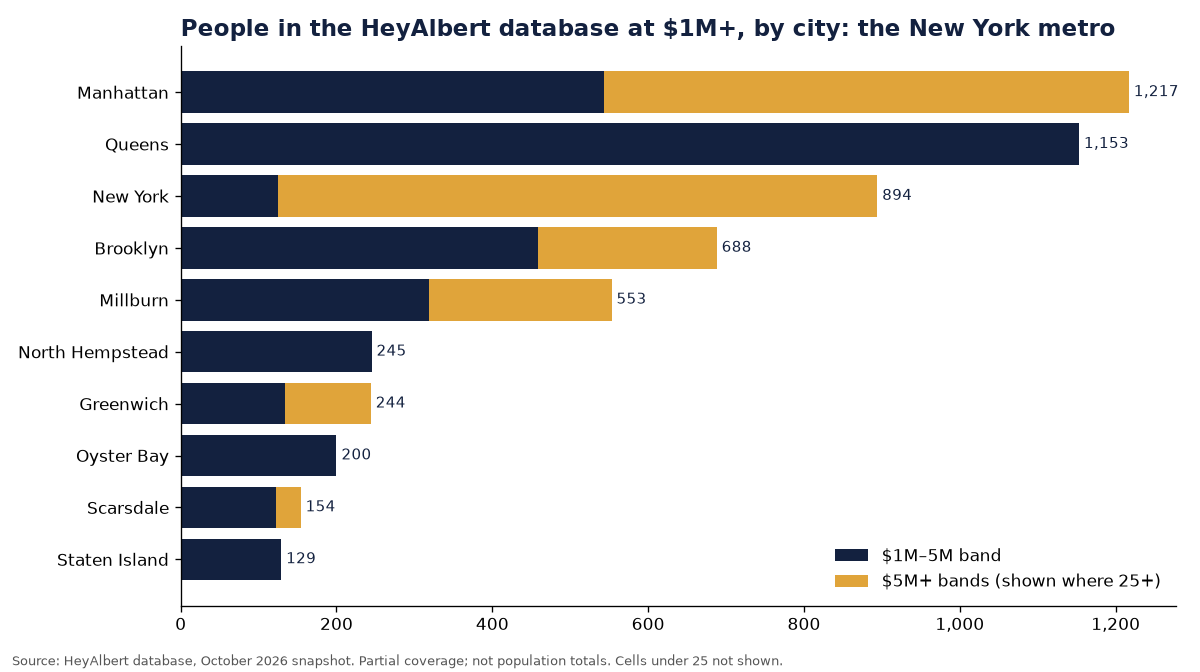
| City | $1M+ | of which $5M+ | of which $25M+ |
|---|---|---|---|
| Manhattan | 1,217 | 674 | 236 |
| Queens | 1,153 | <25 | <25 |
| New York | 894 | 769 | 329 |
| Brooklyn | 688 | 229 | 48 |
| Millburn | 553 | 234 | <25 |
| North Hempstead | 245 | <25 | <25 |
| Greenwich | 244 | 110 | 44 |
| Oyster Bay | 200 | <25 | <25 |
| Scarsdale | 154 | 32 | <25 |
| Staten Island | 129 | <25 | <25 |
| Glen Head | 112 | 70 | <25 |
| Hoboken | 111 | 32 | <25 |
Source: HeyAlbert database [9]. Cities with 25+ people at $1M+; cells under 25 shown as <25. The city is where our sources place the person; for some records it is a workplace rather than a home.
Our database places 9,463 people in the New York metro at $1M+, including 815 at $25M+ [9]. Those upper tiers sit in Manhattan and in New York City records without a borough (together 1,443 people at $5M+), and in Greenwich, Connecticut, which has 244 people in our set, 110 of them at $5M+ [9]. Queens has 1,153 people in our set but fewer than 25 in the $5M+ bands, and Millburn, New Jersey, has 553 [9].
Why our the New York metro count looks the way it does
Each estimate in our database rests on a primary piece of public evidence. The mix differs from place to place, depending on which records we have been able to process, and it shapes the counts above more than any real difference in wealth does [9].
| Primary evidence for the estimate | People | Share |
|---|---|---|
| Home value (public assessor or listing records) | 5,570 | 59% |
| Other public signals (executive roles, company filings, gifts, pay) | 3,450 | 36% |
| Physician (NPI registry; seniority and specialty estimate) | 313 | 3% |
| Patent inventors (with company context) | 64 | 1% |
| Professional license | 32 | 0% |
Source: HeyAlbert database [9], people at $1M+. Categories under 25 not shown.
About 59% of our New York metro estimates rest on home values, which is why Queens, Long Island and the New Jersey suburbs show many people in the $1M–5M band. The Manhattan and Greenwich upper tier is documented mainly through executive roles, filings and gifts [9].
Giving signals
533 of the 9,463 people in our the New York metro set (5.6%) have at least one public giving signal, such as a named gift on a donor roll or a role at a charity [9]. By cause, counting each person once per cause:
| Cause area | People with a signal |
|---|---|
| Other causes | 160 |
| Education | 142 |
| Human services | 110 |
| Community and ethnic organizations | 73 |
| Arts and culture | 73 |
| Health | 53 |
Source: HeyAlbert database [9]. Causes with fewer than 25 people not shown. A person can appear under more than one cause.
What it means if you work with these families
The New York metro is really three markets. The New Jersey corridor from Edison to Parsippany has the population and the growth. Queens and Long Island hold long-established families whose wealth is mostly in property and small businesses. Manhattan and Greenwich hold the finance and corporate fortunes. Advisors and nonprofits who treat the metro as one market tend to over-serve the last group and miss the first two.
Methodology
Census figures are American Community Survey 5-year estimates for 2020–2024 and 2015–2019, Table B02018, using “Asian Indian, alone or in any combination” [1][2]. Total population comes from Table B01003 [3]. The Census Bureau changed how it codes detailed race responses in 2020, so part of the change between the two periods may reflect coding rather than migration. All estimates carry margins of error. Shares and growth rates are our calculations.
HeyAlbert counts are aggregates from our database as of October 2026 [9]. They include people we identified as likely of Indian origin with an estimated net worth of $1M or more, based on public records such as property assessments, professional licenses, patents, SEC filings and donor rolls. Coverage is partial and depends on which public records exist and which we have processed. These counts are not population totals. Any cell under 25 is suppressed, and we publish aggregates only, never individual records.
Related
- How large and affluent is the Indian American community in the New York metro area?
- Why is New Jersey, and Middlesex County in particular, a hub for Indian Americans?
- Indian-American wealth in New York State
- Indian-American wealth in New Jersey
HeyAlbert finds Indian-American families worth $1M+ and tells you who to call, with every fact cited. See who is in the New York metro at heyalbert.site.
Sources
- ACS 2020–2024 5-year estimates, Table B02018, all metropolitan statistical areas. US Census Bureau. https://data.census.gov/table/ACSDT5Y2024.B02018?g=010XX00US$3100000 (data: machine-readable)
- ACS 2015–2019 5-year estimates, Table B02018, all metropolitan statistical areas. US Census Bureau. https://data.census.gov/table/ACSDT5Y2019.B02018?g=010XX00US$3100000 (data: machine-readable)
- ACS 2020–2024 5-year estimates, Table B01003, all metropolitan statistical areas. US Census Bureau. https://data.census.gov/table/ACSDT5Y2024.B01003?g=010XX00US$3100000 (data: machine-readable)
- ACS 2020–2024 5-year estimates, Table B02018, all counties. US Census Bureau. https://data.census.gov/table/ACSDT5Y2024.B02018?g=010XX00US$0500000 (data: machine-readable)
- ACS 2015–2019 5-year estimates, Table B02018, all counties. US Census Bureau. https://data.census.gov/table/ACSDT5Y2019.B02018?g=010XX00US$0500000 (data: machine-readable)
- ACS 2020–2024 5-year, Table B01003, counties in CBSA 35620. US Census Bureau. https://data.census.gov/table/ACSDT5Y2024.B01003?g=310M700US35620$0500000 (data: machine-readable)
- ACS 2020–2024 5-year, Table B02018, places in CBSA 35620. US Census Bureau. https://data.census.gov/table/ACSDT5Y2024.B02018?g=310M700US35620$1600000 (data: machine-readable)
- ACS 2020–2024 5-year, Table B01003, places in CBSA 35620. US Census Bureau. https://data.census.gov/table/ACSDT5Y2024.B01003?g=310M700US35620$1600000 (data: machine-readable)
- HeyAlbert database, aggregate counts (October 2026 snapshot); how we build it is described on our methodology page. HeyAlbert. https://heyalbert.site/research/methodology/
See the data before you talk to us
Read a full sample report to judge the depth and sourcing, then book a walkthrough with your own use case.