
Insight
The fastest-growing Indian-American counties in the US
Forsyth County, Georgia, nearly doubled its Asian Indian population in five years. See the counties gaining and losing the most.
The Indian-American population is growing quickly, but not evenly. Nationally, the Census Bureau's estimate of people reporting Asian Indian ancestry, alone or in combination, rose from about 4.32 million in the 2015–2019 survey to about 5.06 million in 2020–2024, an increase of roughly 17% [5][6] (our calculation). At the county level, some places grew several times faster than that, while some of the oldest communities shrank.
This post ranks US counties by that growth, using the same Census table for both periods, and explains why the pattern matters for anyone who serves Indian-American families.
The fastest-growing large communities
Among the 53 counties that had at least 20,000 residents of Asian Indian descent in 2015–2019, Forsyth County, Georgia, grew fastest, at about 89%, followed by San Joaquin County, California (about 75%), and Collin County, Texas (about 66%) [1][2]. Denton County, Texas, and Wake County, North Carolina, complete the top five [1][2].
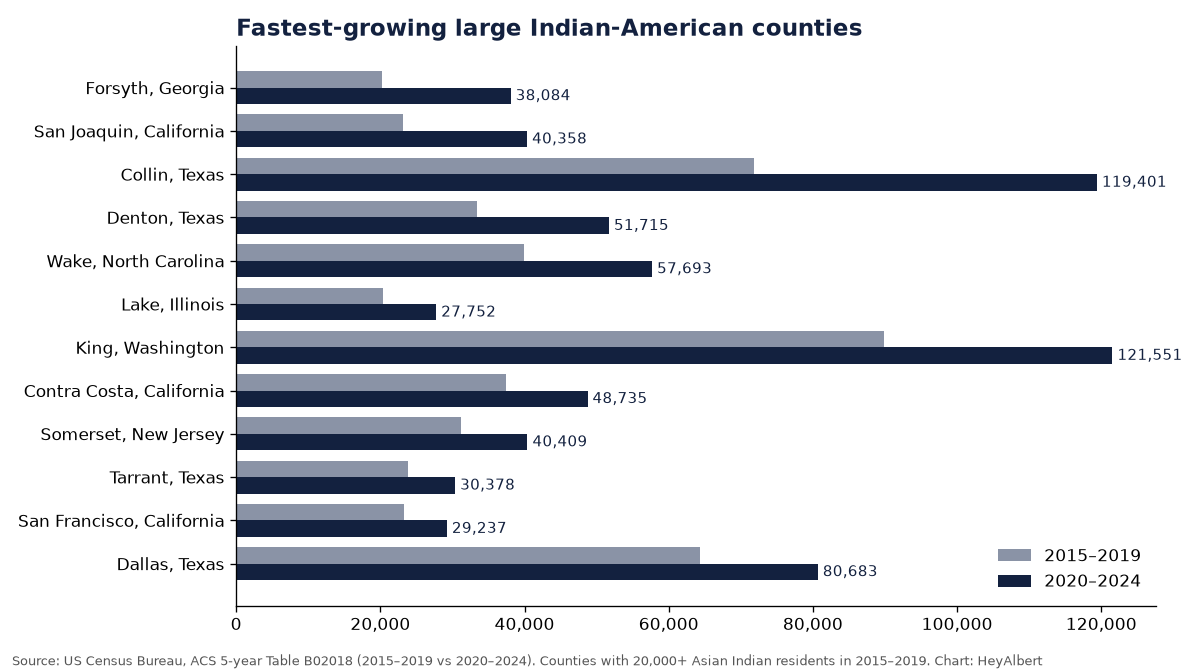
| County | 2015–2019 | 2020–2024 | Change | Share of county, 2020–2024 |
|---|---|---|---|---|
| Forsyth County, Georgia | 20,189 | 38,084 | +89% | 14.2% |
| San Joaquin County, California | 23,114 | 40,358 | +75% | 5.1% |
| Collin County, Texas | 71,840 | 119,401 | +66% | 10.3% |
| Denton County, Texas | 33,416 | 51,715 | +55% | 5.3% |
| Wake County, North Carolina | 39,988 | 57,693 | +44% | 4.9% |
| Lake County, Illinois | 20,383 | 27,752 | +36% | 3.9% |
| King County, Washington | 89,918 | 121,551 | +35% | 5.3% |
| Contra Costa County, California | 37,394 | 48,735 | +30% | 4.2% |
| Somerset County, New Jersey | 31,230 | 40,409 | +29% | 11.6% |
| Tarrant County, Texas | 23,814 | 30,378 | +28% | 1.4% |
| San Francisco County, California | 23,242 | 29,237 | +26% | 3.5% |
| Dallas County, Texas | 64,380 | 80,683 | +25% | 3.1% |
| Hillsborough County, Florida | 26,065 | 32,584 | +25% | 2.1% |
| Broward County, Florida | 28,978 | 36,140 | +25% | 1.8% |
| Loudoun County, Virginia | 39,342 | 48,986 | +25% | 11.3% |
Counties with at least 20,000 Asian Indian residents (alone or in any combination) in 2015–2019. Sources: ACS 5-year Table B02018 [1][2]; county population from Table B01003 [3]. Change and share are our calculations.
The list has a clear geography. Four of the top fifteen are in the Dallas–Fort Worth area (Collin, Denton, Tarrant and Dallas counties) [1][2]. The rest are mostly suburban counties on the edge of established tech and finance hubs: San Joaquin and Contra Costa outside the Bay Area, Lake County outside Chicago, Somerset in central New Jersey, Loudoun outside Washington DC, and Forsyth north of Atlanta [1][2].
The largest gains in raw numbers
Percentages favor smaller bases. Ranked by the number of people added, Collin County leads by a wide margin, adding about 47,600 residents of Asian Indian descent between the two surveys, followed by King County, Washington (about 31,600) and Alameda County, California (about 26,700) [1][2].
| County | 2015–2019 | 2020–2024 | People added |
|---|---|---|---|
| Collin County, Texas | 71,840 | 119,401 | +47,561 |
| King County, Washington | 89,918 | 121,551 | +31,633 |
| Alameda County, California | 134,144 | 160,849 | +26,705 |
| Santa Clara County, California | 185,680 | 208,719 | +23,039 |
| Denton County, Texas | 33,416 | 51,715 | +18,299 |
| Forsyth County, Georgia | 20,189 | 38,084 | +17,895 |
| Wake County, North Carolina | 39,988 | 57,693 | +17,705 |
| Williamson County, Texas | 18,499 | 36,095 | +17,596 |
| Middlesex County, New Jersey | 133,139 | 150,707 | +17,568 |
| San Joaquin County, California | 23,114 | 40,358 | +17,244 |
| Dallas County, Texas | 64,380 | 80,683 | +16,303 |
| Snohomish County, Washington | 17,937 | 30,502 | +12,565 |
Sources: ACS 5-year Table B02018 [1][2]; our calculation. Connecticut is excluded from this ranking because it replaced its counties with planning regions in Census data after 2020, so the two periods do not match.
Fast-rising mid-size communities
Below the 20,000 threshold, a second group is growing even faster. Williamson County, Texas, north of Austin, nearly doubled, and Snohomish County, Washington, grew about 70% [1][2]. Hamilton County, Indiana (the Carmel and Fishers area), and Delaware and Warren counties in Ohio show that the growth is not confined to the coasts [1][2].
| County | 2015–2019 | 2020–2024 | Change |
|---|---|---|---|
| Williamson County, Texas | 18,499 | 36,095 | +95% |
| Hamilton County, Indiana | 7,281 | 12,729 | +75% |
| Snohomish County, Washington | 17,937 | 30,502 | +70% |
| Albany County, New York | 5,799 | 9,641 | +66% |
| Benton County, Arkansas | 5,569 | 8,259 | +48% |
| Douglas County, Colorado | 7,092 | 10,498 | +48% |
| Marion County, Indiana | 7,444 | 11,016 | +48% |
| Delaware County, Ohio | 8,208 | 12,061 | +47% |
| Warren County, Ohio | 7,286 | 10,599 | +45% |
| Cumberland County, Pennsylvania | 5,226 | 7,519 | +44% |
Counties with 5,000–19,999 Asian Indian residents in 2015–2019. Sources: ACS 5-year Table B02018 [1][2]; our calculation.
Where the community shrank
Seven of the 53 large counties had fewer residents of Asian Indian descent in 2020–2024 than in 2015–2019 [1][2]. Queens, historically one of the country's largest Indian-American communities, fell about 11%, and Brooklyn, Fairfax, Los Angeles and Bergen counties also declined [1][2].
| County | 2015–2019 | 2020–2024 | Change |
|---|---|---|---|
| Queens County, New York | 149,507 | 132,937 | -11% |
| Kings County, New York | 37,375 | 35,091 | -6% |
| Fairfax County, Virginia | 59,875 | 57,099 | -5% |
| Hennepin County, Minnesota | 26,957 | 25,709 | -5% |
| Los Angeles County, California | 116,854 | 112,845 | -3% |
| Bergen County, New Jersey | 36,301 | 35,304 | -3% |
| Franklin County, Ohio | 25,599 | 25,354 | -1% |
Large counties (20,000+ in 2015–2019) with a lower 2020–2024 estimate. Sources: ACS 5-year Table B02018 [1][2]; our calculation. Several of these changes are within the surveys’ margins of error.
What it means
The movement is from dense, expensive inner suburbs to newer, larger-home suburbs farther out, and from the coasts toward Texas, Georgia and North Carolina. For financial advisors, real-estate professionals and nonprofits, that means the families you met in Queens or Fairfax ten years ago may now be in Nassau, Loudoun's newer subdivisions or Collin County. In our own database, many of these fast-growth suburbs show large numbers of people in the $1M–5M band, often on home-equity evidence, which you can see in our Texas, Georgia, North Carolina and Washington posts [4].
Methodology
All counts are ACS 5-year estimates from Table B02018, “Asian Indian, alone or in any combination”: variable B02018_002 in the 2015–2019 release and B02018_021 in the 2020–2024 release, which carry the same definition after the table was renumbered [1][2]. County population comes from Table B01003 [3]. The Census Bureau changed how it codes detailed race responses in 2020, so some of the change may reflect coding rather than migration, and every estimate has a margin of error. Growth rates and rankings are our calculations. Counties are matched across periods by their Census geographic identifiers.
Related research
- Which US states have the largest and wealthiest Indian American populations?
- Are Indian Americans moving to Florida, Texas or Nevada for tax reasons?
HeyAlbert finds Indian-American families worth $1M+ and tells you who to call, with every fact cited. Explore the people behind these totals at heyalbert.site.
Sources
- ACS 2020–2024 5-year estimates, Table B02018, all counties. US Census Bureau. https://data.census.gov/table/ACSDT5Y2024.B02018?g=010XX00US$0500000 (data: machine-readable)
- ACS 2015–2019 5-year estimates, Table B02018, all counties. US Census Bureau. https://data.census.gov/table/ACSDT5Y2019.B02018?g=010XX00US$0500000 (data: machine-readable)
- ACS 2020–2024 5-year estimates, Table B01003 (total population), all counties. US Census Bureau. https://data.census.gov/table/ACSDT5Y2024.B01003?g=010XX00US$0500000 (data: machine-readable)
- HeyAlbert database, aggregate counts (October 2026 snapshot); how we build it is described on our methodology page. HeyAlbert. https://heyalbert.site/research/methodology/
- ACS 2020–2024 5-year estimates, Table B02018, United States. US Census Bureau. https://data.census.gov/table/ACSDT5Y2024.B02018?g=010XX00US (data: machine-readable)
- ACS 2015–2019 5-year estimates, Table B02018, United States. US Census Bureau. https://data.census.gov/table/ACSDT5Y2019.B02018?g=010XX00US (data: machine-readable)
See the data before you talk to us
Read a full sample report to judge the depth and sourcing, then book a walkthrough with your own use case.