
Insight
Menlo Park, CA: a smaller community, 223 people in our $5M+ bands
Menlo Park's Asian Indian community fell about 29% in the survey to about 1,000. Our database places 299 people there at $1M+, 223 of them at $5M+.
Menlo Park has about 1,000 residents of Asian Indian descent, down 29% from about 1,400 in the 2015–2019 survey [1][2]. They are 3.0% of a city of about 32,700 [1][3].
Our database tells a different story about wealth. It places 299 people at an estimated $1M+ under the Menlo Park name, and 223 of them, about three in four, in our $5M+ bands (our calculation) [6].
- 981 residents of Asian Indian descent (alone or in combination) in Menlo Park, California, 2020–2024 average [1], or 3.0% of the population [3].
- -29.3% versus the 2015–2019 estimate of 1,387 [1][2] (our calculation).
- 299 people in the HeyAlbert database placed in Menlo Park, California at an estimated $1M+, of whom 223 are in our $5M+ bands [6].
How Menlo Park compares with nearby places
The Census Bureau's American Community Survey counts 981 people who report Asian Indian ancestry, alone or with another group, in Menlo Park [1], against 1,387 in 2015–2019 [2]. The table compares it with the places in San Mateo County that have the largest Asian Indian communities. Figures are for whole places, and some places extend into neighboring counties [1][2][4].
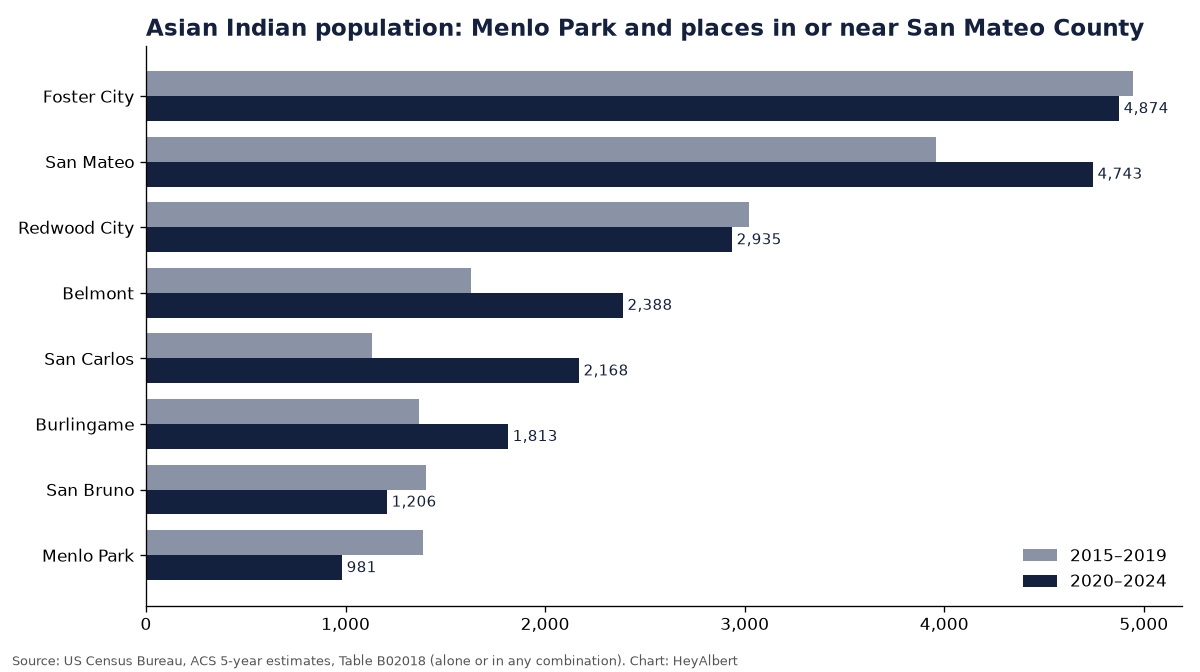
| Place | 2020–2024 | 2015–2019 | Change | Share of place |
|---|---|---|---|---|
| Foster City | 4,874 | 4,944 | -1% | 14.9% |
| San Mateo | 4,743 | 3,957 | 20% | 4.6% |
| Redwood City | 2,935 | 3,020 | -3% | 3.6% |
| Belmont | 2,388 | 1,630 | 47% | 8.7% |
| San Carlos | 2,168 | 1,132 | 92% | 7.3% |
| Burlingame | 1,813 | 1,369 | 32% | 5.9% |
| San Bruno | 1,206 | 1,403 | -14% | 2.9% |
| Menlo Park | 981 | 1,387 | -29% | 3.0% |
Asian Indian alone or in any combination. Sources: ACS 5-year estimates [1][2][4]; totals from Table B01003. Change and share are our calculations. Estimates carry margins of error.
In San Mateo County, the largest communities are in Foster City and San Mateo, at about 4,900 and 4,700 [1][2][4]. Foster City has the highest share of the larger places, about 15% [1][2][4]. San Carlos and Belmont grew fastest among the places shown, up 92% and 47% [1][2][4].
The most concentrated communities
Raw counts favor big cities. Ranking places of 20,000+ residents by the share who report Asian Indian ancestry gives a different map [1][2][3][4][5]:
| Place | Asian Indian residents | Total population | Share |
|---|---|---|---|
| Foster City | 4,874 | 32,792 | 14.9% |
| Belmont | 2,388 | 27,337 | 8.7% |
| San Carlos | 2,168 | 29,614 | 7.3% |
| Burlingame | 1,813 | 30,525 | 5.9% |
| San Mateo | 4,743 | 103,105 | 4.6% |
| Redwood City | 2,935 | 82,447 | 3.6% |
| San Bruno | 1,206 | 42,307 | 2.9% |
Places with 20,000+ residents and at least 1,000 Asian Indian residents. CDP = census-designated place. Sources: ACS 2020–2024 5-year, Tables B02018 and B01003 [1][2][3][4][5]; shares are our calculation.
What the HeyAlbert database shows in Menlo Park, California
HeyAlbert builds profiles of Indian-American individuals with an estimated net worth of $1M or more from public records, and every estimate is tied to a cited source. Our database currently places 299 such people in Menlo Park, California [6]. That is a count of people we have found and estimated, not a census of wealthy households: our coverage is partial and uneven.
| Estimated net-worth band | People in our database |
|---|---|
| $5M+ | 223 |
| $1M–5M | 76 |
| Total, $1M+ | 299 |
Source: HeyAlbert database [6]. Bands are estimates from public evidence; $5M+ combines our $5–15M and $25M+ tiers. Cells under 25 are suppressed.
| City | $1M+ | of which $5M+ |
|---|---|---|
| Menlo Park | 299 | 223 |
Source: HeyAlbert database [6]. Cities with 25+ people at $1M+; cells under 25 shown as <25. The city is where our sources place the person; for some records it is a workplace rather than a home. Our records are matched on the city name Menlo Park; the Census figures are for the whole place.
Of the 299 people in our Menlo Park set, 223 are in our $5M+ bands and 76 in the $1M–5M band [6]. Fewer than 25 have a public giving signal [6].
Why our Menlo Park, California count looks the way it does
Each estimate in our database rests on a primary piece of public evidence. The mix differs from place to place, depending on which records we have been able to process, and it shapes the counts above more than any real difference in wealth does [6].
| Primary evidence for the estimate | People | Share |
|---|---|---|
| Other public signals (executive roles, company filings, gifts, pay) | 233 | 78% |
| Home value (public assessor or listing records) | 34 | 11% |
Source: HeyAlbert database [6], people at $1M+. Categories under 25 not shown.
Other public signals, such as executive roles, equity and company filings, support 233 of the 299 estimates, and home values 34 [6]. Patent records and other evidence types each support fewer than 25 [6]. Some of the people we place in Menlo Park may be counted by a business or mailing address rather than a home [6].
What it means if you work with these families
For advisors, Menlo Park is a place where a small resident community sits beside a deep $5M+ group in our data, much of it found through company and equity records [1][6]. Our Palo Alto, Redwood City and San Mateo County posts cover the neighbors.
Methodology
Census figures are American Community Survey 5-year estimates for 2020–2024 and 2015–2019, Table B02018, using “Asian Indian, alone or in any combination” [1][2]. Total population comes from Table B01003 [3]. The Census Bureau changed how it codes detailed race responses in 2020, so part of the change between the two periods may reflect coding rather than migration. All estimates carry margins of error. Shares and growth rates are our calculations.
HeyAlbert counts are aggregates from our database as of November 8, 2026 [6]. They include people we identified as likely of Indian origin with an estimated net worth of $1M or more, based on public records such as property assessments, professional licenses, patents, SEC filings and donor rolls. Coverage is partial and depends on which public records exist and which we have processed. These counts are not population totals. Any cell under 25 is suppressed, and we publish aggregates only, never individual records.
Related
- Indian-American wealth in San Mateo County: a small community, a large top tier
- Palo Alto, CA: 5,200 residents of Indian descent, 671 in our $5M+ bands
- Redwood City, CA: a flat community, and our set split evenly at $5M
- Indian-American wealth in the Bay Area: three in five in our data are $5M+
HeyAlbert maps 209K+ wealthy Indian-American households and tells you who to call, with every fact cited. See who is in Menlo Park, California at heyalbert.site.
Sources
- ACS 2020–2024 5-year estimates, Table B02018, places in California. US Census Bureau. https://data.census.gov/table/ACSDT5Y2024.B02018?g=040XX00US06$1600000 (data: machine-readable)
- ACS 2015–2019 5-year estimates, Table B02018, places in California. US Census Bureau. https://data.census.gov/table/ACSDT5Y2019.B02018?g=040XX00US06$1600000 (data: machine-readable)
- ACS 2020–2024 5-year estimates, Table B01003 (total population), places in California. US Census Bureau. https://data.census.gov/table/ACSDT5Y2024.B01003?g=040XX00US06$1600000 (data: machine-readable)
- ACS 2020–2024 5-year estimates, Table B02018, places in San Mateo County, California. US Census Bureau. https://data.census.gov/table/ACSDT5Y2024.B02018?g=050XX00US06081$1600000 (data: machine-readable)
- ACS 2020–2024 5-year estimates, Table B01003, places in San Mateo County, California. US Census Bureau. https://data.census.gov/table/ACSDT5Y2024.B01003?g=050XX00US06081$1600000 (data: machine-readable)
- HeyAlbert database, aggregate counts (snapshot as of November 8, 2026); how we build it is described on our methodology page. HeyAlbert. https://heyalbert.site/research/methodology/
Verified floor: public records only · heyalbert.site/why-our-counts-are-a-floor
See the data before you talk to us
Read a full sample report to judge the depth and sourcing, then book a walkthrough with your own use case.