
Insight
Where $25M+ Indian-American families live: cities and states in our data
Our database counts 5,831 people at an estimated $25M+. California, New York and Texas lead, and New York City tops the city list.
HeyAlbert's database currently includes 5,831 people of likely Indian origin whom we estimate to have a net worth of $25 million or more: 4,229 we rate as “likely” and 1,602 as “probable” [1]. Those labels describe our confidence in the tier, based on the public evidence behind each estimate. This post maps where those people are, by state and by city, and what industries their wealth comes from where we know it.
As with all our counts, these are people we have found and estimated, not a census of every Indian-American family at that level. But even a partial count shows a striking concentration.
By state
California accounts for 1,523 of the 5,831, about 26% [1] (our calculation). New York (723) and Texas (719) are close to each other in second and third place, then Florida (336) and Washington (260) [1]. Texas is notable for how many of its $25M+ people we rate as “likely” rather than “probable”: 623 of 719 [1]. Connecticut, with 83, ranks ahead of several far larger states; Greenwich alone accounts for 44 of them [1].
| State | People at $25M+ | Share of our $25M+ set | “Likely” | “Probable” |
|---|---|---|---|---|
| CA | 1,523 | 26.1% | 1,010 | 513 |
| NY | 723 | 12.4% | 452 | 271 |
| TX | 719 | 12.3% | 623 | 96 |
| FL | 336 | 5.8% | 281 | 55 |
| WA | 260 | 4.5% | 207 | 53 |
| MA | 215 | 3.7% | 106 | 109 |
| NJ | 181 | 3.1% | 124 | 57 |
| IL | 163 | 2.8% | 113 | 50 |
| VA | 93 | 1.6% | 26 | 67 |
| CT | 83 | 1.4% | 55 | 28 |
| PA | 78 | 1.3% | 37 | 41 |
| GA | 73 | 1.3% | 39 | 34 |
| MD | 59 | 1.0% | <25 | 40 |
| MI | 56 | 1.0% | 44 | <25 |
| OH | 53 | 0.9% | 45 | <25 |
| CO | 42 | 0.7% | 25 | <25 |
| AZ | 37 | 0.6% | 29 | <25 |
| NC | 33 | 0.6% | <25 | <25 |
| DE | 33 | 0.6% | <25 | 27 |
Source: HeyAlbert database [1]. States with 25+ people at $25M+; cells under 25 shown as <25. Shares are our calculation. A small number of records have no state and are not shown.
By city
At city level, New York City dominates: 317 people we place in New York City without a borough recorded and 236 in Manhattan, a combined 553 [1]. San Francisco (189) and Palo Alto (146) follow, then Houston (108) and Dallas (95) [1]. The Bay Area contributes more cities to the list than any other region: Saratoga, San Jose, Menlo Park, Los Altos and Los Altos Hills all have 50 or more people at $25M+ in our data [1]. Greenwich, Connecticut, makes the list with 44 [1].
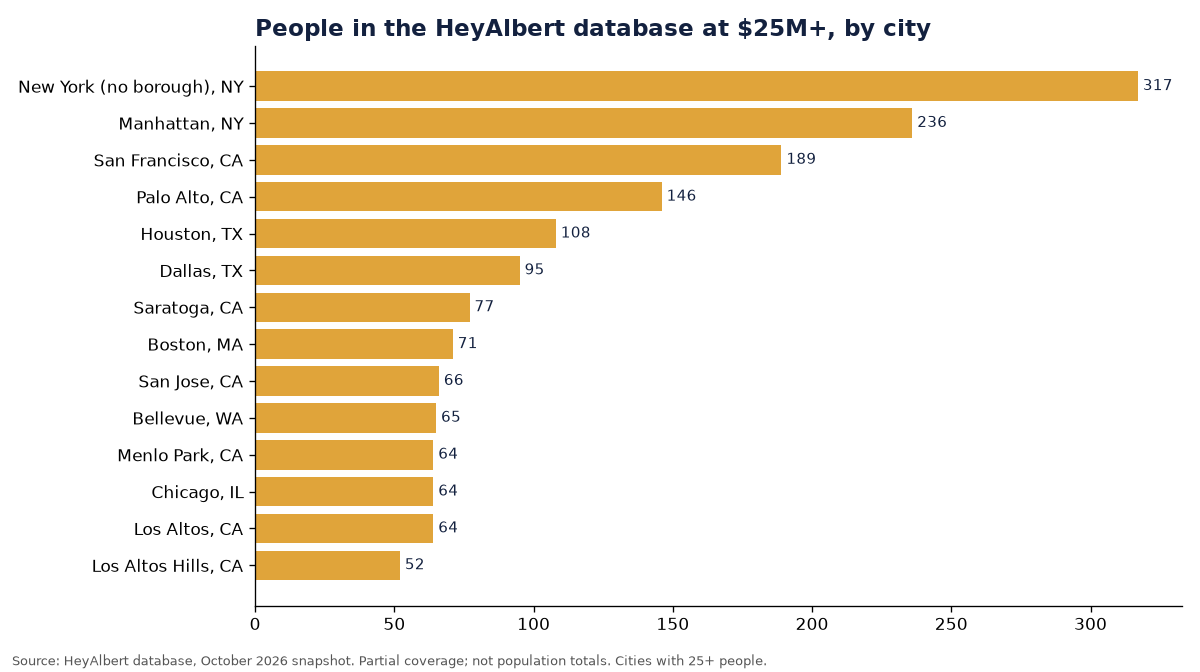
| City | People at $25M+ | of which “likely” |
|---|---|---|
| New York (city, borough not recorded), NY | 317 | 130 |
| Manhattan, NY | 236 | 211 |
| San Francisco, CA | 189 | 98 |
| Palo Alto, CA | 146 | 97 |
| Houston, TX | 108 | 91 |
| Dallas, TX | 95 | 74 |
| Saratoga, CA | 77 | 69 |
| Boston, MA | 71 | 28 |
| San Jose, CA | 66 | 48 |
| Bellevue, WA | 65 | 55 |
| Menlo Park, CA | 64 | 42 |
| Chicago, IL | 64 | 33 |
| Los Altos, CA | 64 | 58 |
| Los Altos Hills, CA | 52 | 44 |
| Brooklyn, NY | 48 | 36 |
| Los Angeles, CA | 48 | 34 |
| Seattle, WA | 45 | <25 |
| Greenwich, CT | 44 | 33 |
| Austin, TX | 44 | 35 |
| Irving, TX | 40 | 34 |
| Miami, FL | 37 | 29 |
| Atlanta, GA | 36 | <25 |
| Denton, TX | 36 | 36 |
| Atherton, CA | 33 | 30 |
| Hillsborough, CA | 32 | 28 |
| Mountain View, CA | 32 | <25 |
| Miami Beach, FL | 31 | 27 |
| Fremont, CA | 31 | <25 |
| Clyde Hill, WA | 30 | 30 |
| Wilmington, DE | 30 | <25 |
| San Diego, CA | 30 | <25 |
| Santa Clara, CA | 26 | <25 |
| Pleasanton, CA | 25 | <25 |
| Cupertino, CA | 25 | <25 |
Source: HeyAlbert database [1]. Cities with 25+ people at $25M+; cells under 25 shown as <25. The city is where our sources place the person, usually a home city; for a minority of records it may be a workplace. One cluster of records with an unverified city is excluded.
Where the wealth comes from
We record an industry for 2,187 of the 5,831 people at $25M+ [1]. Among them, tech and biotech lead with 885, followed by healthcare and medicine (441), hospitality (357) and finance (339) [1]. Hospitality's place reflects the Indian-American hotel ownership story, which you can read about in our research on why so many motels are owned by Patels.
| Industry (where recorded) | People at $25M+ |
|---|---|
| Tech and biotech | 885 |
| Healthcare and medicine | 441 |
| Hospitality | 357 |
| Finance | 339 |
| IT services and staffing | 117 |
| Real estate, franchise and trading | 48 |
Source: HeyAlbert database [1]. Industry is recorded for a subset of records; the rest are unknown or not recorded, so these are not shares of the whole tier.
Giving at the top
People in our $25M+ tier are more likely to show a public giving signal than those in our first band. 441 of the 5,831 (about 7.6%) have at least one, such as a charity board seat, a named gift or a foundation role, compared with about 5.2% of people in our $1M–5M band [1] (our calculation). Both figures are floors: they count only giving that leaves a public trace.
What it means
For private banks, family offices, nonprofits and luxury brands, the $25M+ tier is concentrated enough to plan around a short list of cities: New York, the Peninsula and South Bay, San Francisco, Houston, Dallas, Boston and Greenwich account for a large share of the people in our data. Outside those, Texas and Florida stand out for the number of high-confidence estimates. Our metro comparison shows how this tier lines up with population.
Methodology
Counts come from the HeyAlbert database as of October 2026 [1]. A person enters the $25M+ tier when the public evidence (for example, company ownership, SEC filings, executive compensation, large property holdings or major gifts) supports that estimate; “likely” and “probable” reflect the strength of that evidence. Estimates can be wrong in either direction, and we revise them as evidence changes. HeyAlbert counts are aggregates from our database as of October 2026. They include people we identified as likely of Indian origin with an estimated net worth of $1M or more, based on public records such as property assessments, professional licenses, patents, SEC filings and donor rolls. Coverage is partial and uneven across places, because it depends on which public records exist and which we have processed. These are counts of people in our database, not population totals. Any cell under 25 is suppressed, and we publish aggregates only, never individual records.
Related research
- How many Indian American millionaires and billionaires are there?
- Who are the richest Indian Americans in 2026?
- How do wealthy Indian Americans run family offices?
HeyAlbert finds Indian-American families worth $1M+ and tells you who to call, with every fact cited. Explore the people behind these totals at heyalbert.site.
Sources
- HeyAlbert database, aggregate counts (October 2026 snapshot); how we build it is described on our methodology page. HeyAlbert. https://heyalbert.site/research/methodology/
See the data before you talk to us
Read a full sample report to judge the depth and sourcing, then book a walkthrough with your own use case.