
Short answer
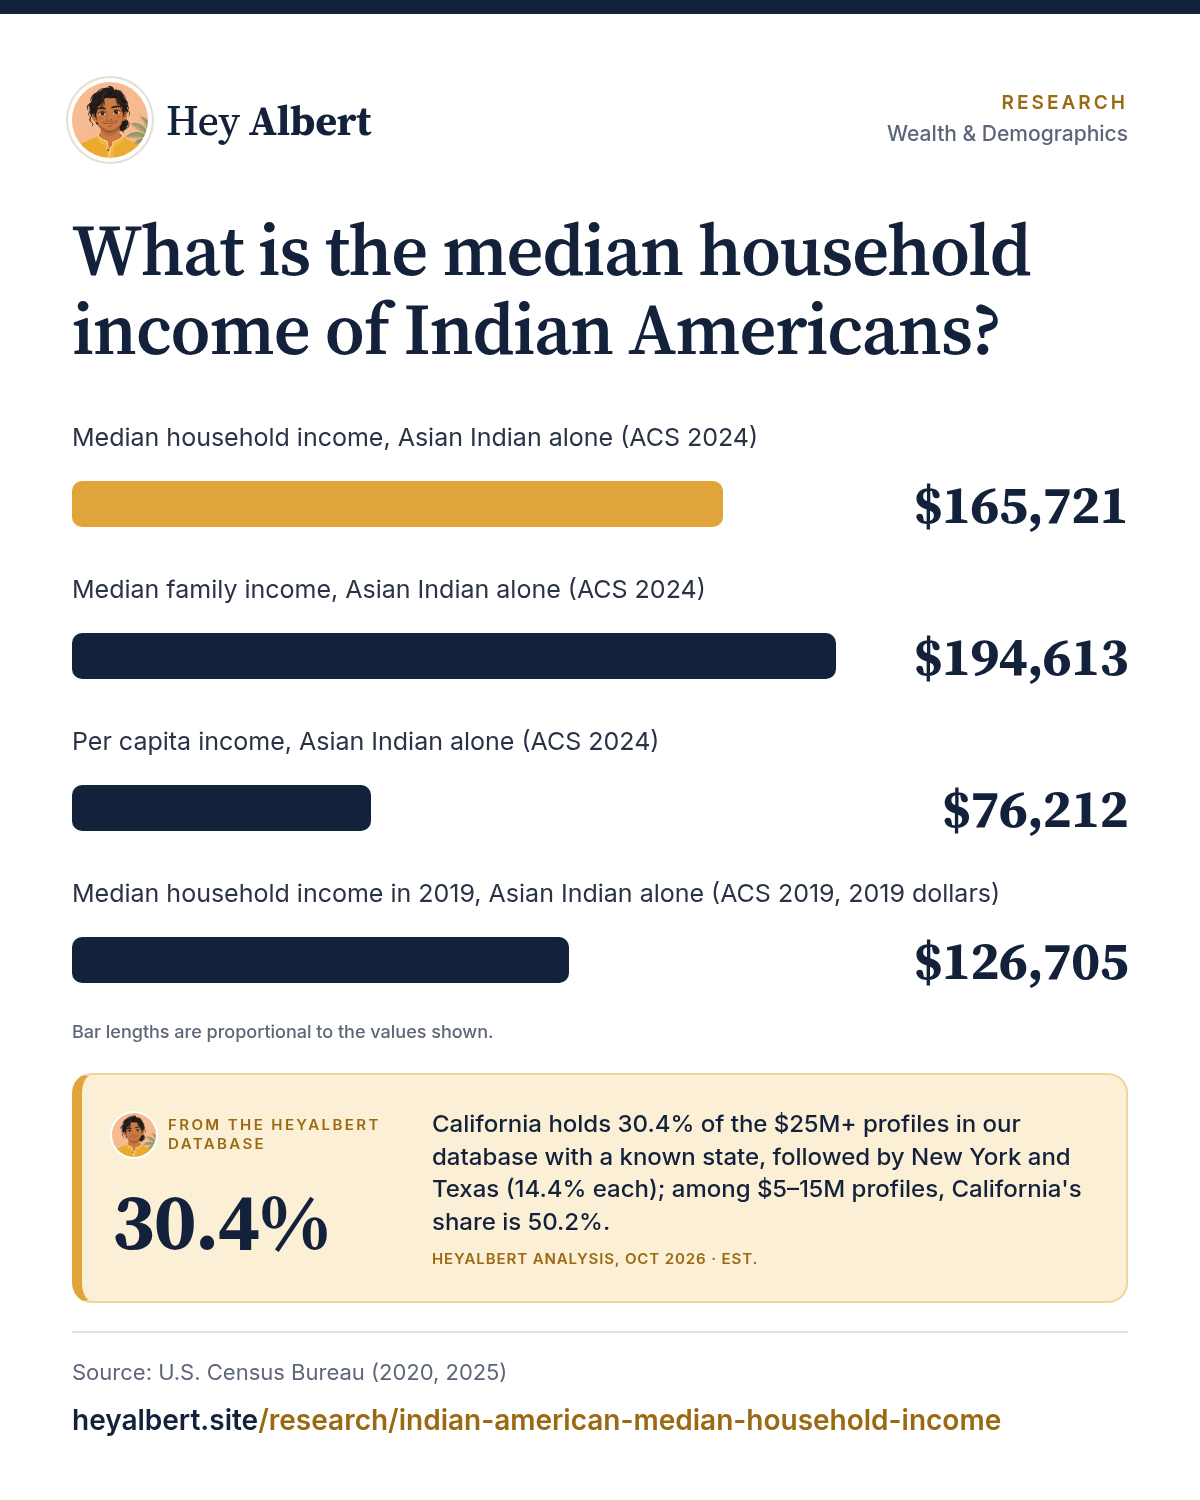
The median household income of Indian Americans was $165,721 in 2024, according to the Census Bureau's American Community Survey, the latest data available as of October 20261. That is about twice the median for all US households ($81,604) and up from $126,705 in 20192,3. 2025 figures have not yet been published.
HeyAlbert data shows California holds 30.4% of the $25M+ profiles in our database with a known state, followed by New York and Texas (14.4% each); among $5–15M profiles, California's share is 50.2%. See the data · Methodology
The latest figure
In the 2024 American Community Survey (ACS) one-year estimates, households headed by someone who identifies as Asian Indian alone had a median income of $165,7211. Half of these households earned more and half earned less. The median for all US households in the same survey was $81,6042.
Definitions matter here. If you widen the group to everyone who reports Asian Indian alone or in combination with another race or origin, a population of about 5.56 million, the median is $161,5201. Pew Research Center, using a three-year (2021–23) sample of the same survey, reported a median of $151,200 for 20235. All of these figures show the same thing: Indian American households have the highest median income of any major group in the country, as we explain in are Indian Americans the richest ethnic group.
What HeyAlbert data shows
How the figure has changed since 2019
Median household income, Asian Indian alone, ACS one-year estimates (current dollars of each year)1,3,6:
| Year | Asian Indian households | All US households |
|---|---|---|
| 2019 | $126,705 | $65,712 |
| 2021 | $141,906 | $69,717 |
| 2022 | $152,341 | $74,755 |
| 2023 | $157,005 | $77,719 |
| 2024 | $165,721 | $81,604 |
These are not adjusted for inflation, and part of the increase reflects rising prices. The Census Bureau did not release standard 2020 one-year estimates because of pandemic disruption to data collection. Over the same period the Asian Indian alone population grew from about 4.24 million to about 5.09 million1,3, so the median has risen even as large numbers of newer, often younger, arrivals joined the population.
Household, family and individual income
Household income adds up everyone living under one roof, so it is affected by how many earners a household has. Other measures help put the headline number in context1:
- Median family income (households of related people): $194,613.
- Per capita income (total income divided by every resident, including children): $76,212, compared with $45,256 for the US as a whole2.
- Median earnings, full-time year-round workers: $125,682 for men and $98,940 for women.
- Average household size: 2.85 people, compared with 2.50 nationally2.
Married-couple households are common (69.7% of Asian Indian households, versus 46.7% nationally)1,2, so many households have two earners. That is one of several factors we cover in why Indian Americans out-earn the average American.
Where the income comes from
Earnings from work drive most of the gap. In 2024, 72.7% of Asian Indians aged 16 and over were in the labor force, compared with 64.0% of all Americans1,2. Among those employed, 75.7% worked in management, business, science and arts occupations, against 43.5% of all US workers1,2.
By industry, the largest share of employed Asian Indians (27.3%) worked in professional, scientific, management and administrative services, a category that includes software, IT services and consulting. Another 22.7% worked in education, health care and social assistance, and 10.7% in finance, insurance and real estate1. Those industries pay well, and many of these roles require advanced degrees, which links income closely to Indian American education levels.
Income by state
Income varies a great deal by place, mostly because of local job markets and living costs. Among the largest Asian Indian populations, ACS 2024 medians were4:
| State | Asian Indian population | Asian Indian median household income | State median, all households |
|---|---|---|---|
| California | 970,717 | $212,558 | $100,149 |
| Texas | 668,034 | $167,991 | $79,721 |
| New Jersey | 448,588 | $188,317 | $104,294 |
| New York | 380,742 | $124,215 | $85,820 |
| Illinois | 282,471 | $142,116 | $83,211 |
| Washington | 187,700 | $230,380 | $99,389 |
Washington and California, both centers of the tech industry, have the highest medians. For a fuller geographic view, see the states with the most Indian Americans and Indian American income by metro area.
Immigrant and US-born households
About 69% of Asian Indians in the US were born abroad1. Pew found that households headed by an Indian immigrant had a higher median income ($156,000) than those headed by a US-born Indian American ($120,200) in 20235. Much of that gap is about age: the median age of US-born Indian Americans was 13.4, so US-born household heads tend to be early in their careers5. We explore this in foreign-born versus US-born Indian Americans.
What the median does not tell you
A median is the midpoint, not the typical experience of every family. The Asian Indian poverty rate was 6.7% in 20241, and Pew's research shows income inequality among Indian American households has grown since 19807. Income is also not the same as wealth, which builds over time through savings, home equity and investments; see what is known about Indian American net worth and how income is spread from top to bottom.
Frequently asked questions
What is the average income of an Indian American household?
The most commonly cited measure is the median, which was $165,721 for Asian Indian households in 2024 according to the Census Bureau's American Community Survey.
Is there a 2025 or 2026 figure yet?
No. As of October 2026 the latest one-year American Community Survey data is for 2024. Figures for 2025 are expected from the Census Bureau later.
How does Indian American income compare with the national median?
In 2024 the Asian Indian median of $165,721 was about twice the $81,604 median for all US households.
Which state has the highest Indian American household income?
Among states with large Asian Indian populations, Washington ($230,380) and California ($212,558) had the highest medians in 2024.
Sources
Figures are from the public sources below, with the data year stated. Estimates are labeled as estimates. Accessed October 24, 2026.
- U.S. Census Bureau, Selected Population Profile in the United States (S0201): Asian Indian alone, 2024 ACS 1-year estimates (2025). data.census.gov ↩ ↩ ↩
- U.S. Census Bureau, Selected Population Profile in the United States (S0201): Total population, 2024 ACS 1-year estimates (2025). data.census.gov ↩ ↩ ↩
- U.S. Census Bureau, Selected Population Profile in the United States (S0201): Asian Indian alone, 2019 ACS 1-year estimates (2020). data.census.gov ↩ ↩ ↩
- U.S. Census Bureau, Selected Population Profile (S0201): Asian Indian alone, by state, 2024 ACS 1-year estimates (2025). data.census.gov ↩ ↩
- Pew Research Center, Facts about Indians in the U.S. (2025). pewresearch.org ↩ ↩ ↩
- U.S. Census Bureau, American Community Survey 1-year Selected Population Profiles (S0201), 2021–2023, via the Census Data API (2024). api.census.gov ↩
- Pew Research Center, Income inequality is greater among Chinese Americans than any other Asian origin group in the U.S. (2024). pewresearch.org ↩