
Short answer
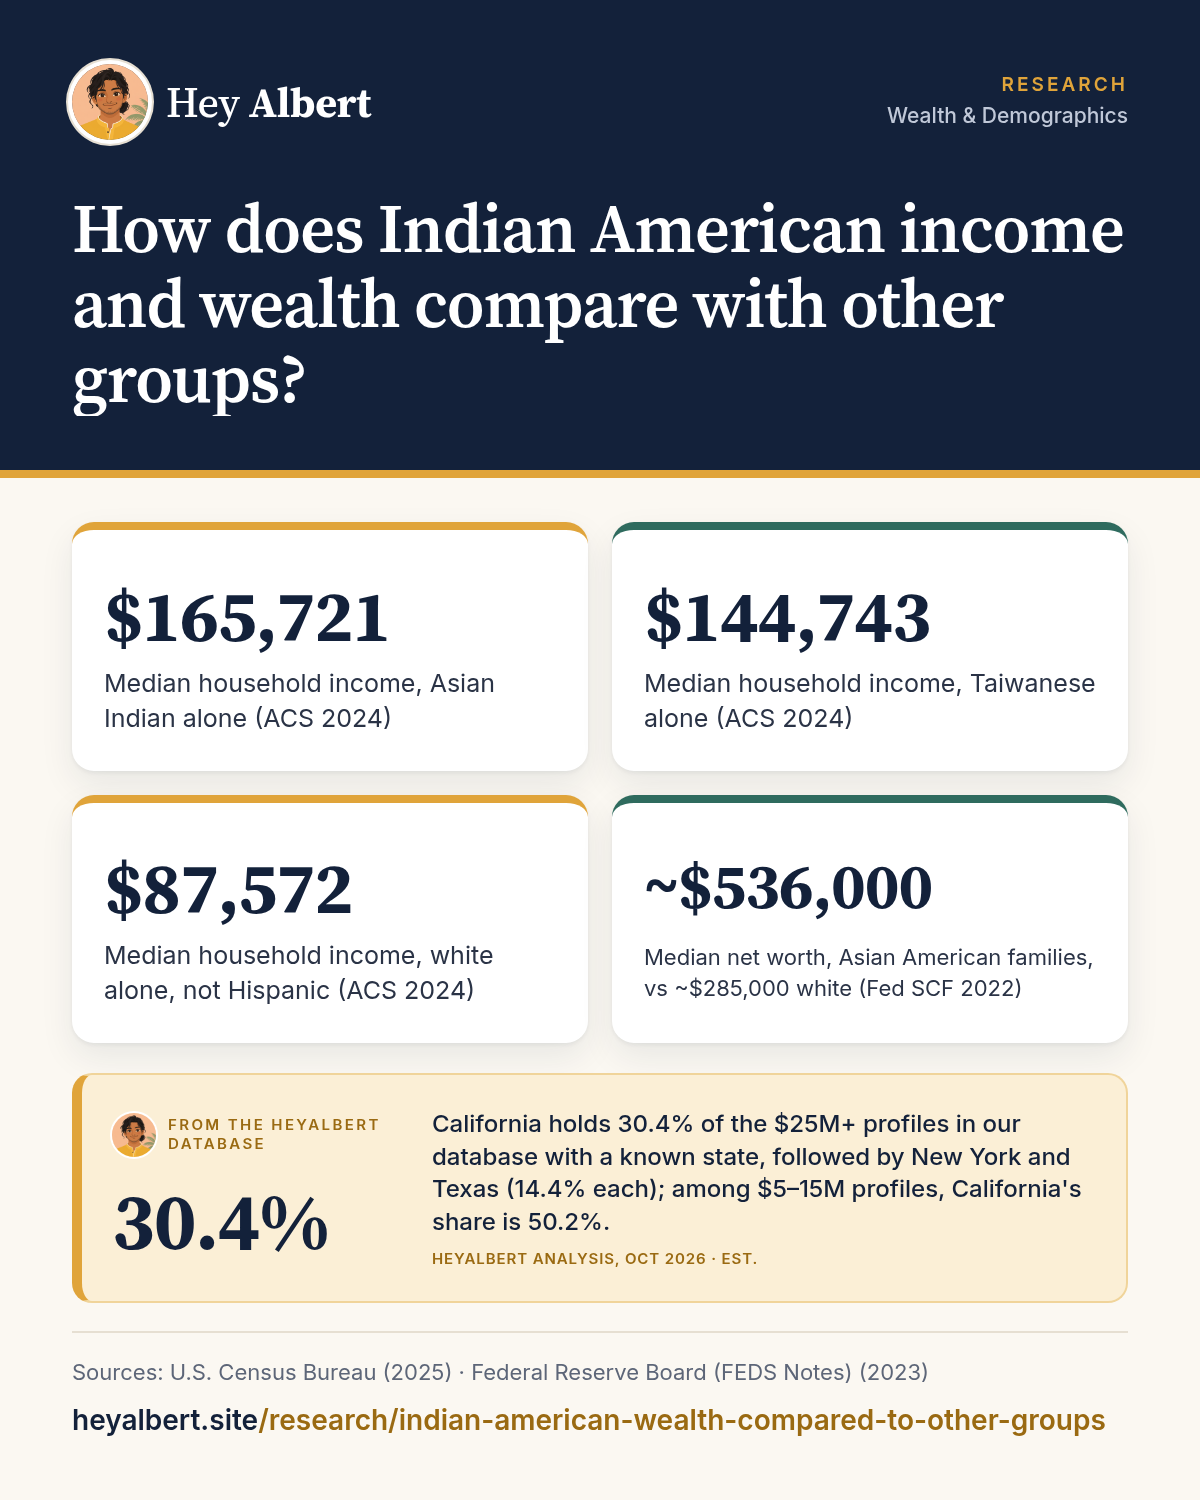
On median household income, Indian Americans lead every major US racial and ethnic group: $165,721 in 2024, compared with $117,289 for all Asian Americans, $87,572 for non-Hispanic white households and $81,604 for the US overall1,2. Taiwanese Americans are close behind and slightly ahead on per capita income. Wealth comparisons are less precise, but Asian American households as a whole had the highest median net worth of any racial group in the Federal Reserve's 2022 survey3.
HeyAlbert data shows California holds 30.4% of the $25M+ profiles in our database with a known state, followed by New York and Texas (14.4% each); among $5–15M profiles, California's share is 50.2%. See the data · Methodology
Income: the Census comparison
The Census Bureau's 2024 American Community Survey profiles let us compare groups on the same basis1,2:
| Group (alone) | Median household income | Per capita income | Bachelor's or higher (25+) | Poverty rate |
|---|---|---|---|---|
| Asian Indian | $165,721 | $76,212 | 78.8% | 6.7% |
| Taiwanese | $144,743 | $83,810 | 81.5% | 8.5% |
| Filipino | $117,783 | $49,331 | 52.6% | 6.5% |
| Pakistani | $111,719 | $46,649 | 61.8% | 11.0% |
| Chinese | $111,125 | $65,180 | 61.3% | 12.0% |
| Korean | $102,682 | $62,787 | 63.4% | 9.8% |
| Japanese | $100,156 | $62,797 | 56.7% | 7.6% |
| White, not Hispanic | $87,572 | $53,079 | 40.8% | 9.1% |
| Hispanic (any race) | $72,574 | $29,435 | 21.5% | 16.2% |
| Black | $56,706 | $32,514 | 26.9% | 20.3% |
| All US | $81,604 | $45,256 | 36.8% | 12.1% |
On household income, Asian Indians are first by a clear margin. On per capita income, which divides total income by every person including children, Taiwanese Americans are higher, partly because Asian Indian households are larger (2.85 people versus 2.39) and younger1. For the headline ranking, see are Indian Americans the richest ethnic group.
What HeyAlbert data shows
Indian vs Chinese Americans
The two largest Asian origin groups make an instructive pair. In 2024 their populations were similar, about 5.1 million Asian Indian alone and 4.8 million Chinese alone1. Yet the Asian Indian median household income ($165,721) was about $55,000 higher than the Chinese American median ($111,125)1. Chinese Americans are older on average (median age 40.8 versus 36.1), more likely to have arrived before 2000, and far more unequal: Pew found Chinese American households had the widest gap between top and bottom earners of any Asian origin group in 2022, while Indian Americans were the top earners at both the 10th and 90th percentiles1,4. Differences in the routes each group's immigrants have used, including the share arriving on skilled-worker visas, are part of the explanation; see the H-1B visa and Indian American wealth.
Indian Americans and other South Asian groups
Asian Indians make up the large majority of the roughly 6.4 million people who identified as South Asian alone in 2024, which is why the South Asian median ($151,905) sits close to the Indian figure1. Other South Asian groups have lower, though still mostly above-average, incomes: Pakistani households had a median of $111,719, Sri Lankan $111,484, Nepalese $102,046 and Bangladeshi $76,3651. Those gaps track differences in immigration routes, time in the US and education, which we explore in Indian American education levels.
Indian vs white Americans
Asian Indian households had a median income almost twice that of non-Hispanic white households in 2024 ($165,721 versus $87,572)1. Education explains much of this: 46.4% of Asian Indian adults held a graduate or professional degree, against 16.2% of non-Hispanic white adults1. Wealth is a different story in some respects. White households are older (median age 44.4 versus 36.1) and more likely to own their homes (73.3% versus 63.0%), and older households have had longer to build and inherit wealth1. Our article on Indian American household net worth covers what wealth surveys show.
Indian vs Jewish Americans
This comparison is often asked about, but the data sources differ. The Census Bureau does not ask about religion, so the main source on Jewish Americans is Pew Research Center's 2020 survey. It found that 23% of Jewish adults reported family incomes of $200,000 or more, compared with 4% of all US adults in the same survey5. Census data shows 30.1% of Asian Indian households with incomes of $200,000 or more in 2017–2021, versus 9.5% of all US households6. Because one is a survey of adults and the other counts households, the numbers are not directly comparable. What both show is that each group is several times more likely than average to be in the top income bracket.
Wealth: what the surveys can say
National wealth surveys report Asian Americans as one group. In the Federal Reserve's 2022 Survey of Consumer Finances, Asian American families had a median net worth of about $536,000 and a mean of about $1.83 million, compared with about $285,000 and $1.37 million for white families3. The Census Bureau found 27.5% of non-Hispanic Asian households held $1 million or more at the end of 2023, versus 22.2% of non-Hispanic white households7. A 2016 Los Angeles study, one of the few to separate origin groups, estimated median household wealth at $592,000 for Japanese Americans, $460,000 for Asian Indians, $408,200 for Chinese Americans and $355,000 for white households8.
For income spread within the community, see how income is distributed among Indian Americans, and for what drives the differences, why Indian Americans are wealthier than average.
Frequently asked questions
Which Asian American group earns the most?
Asian Indian households had the highest median household income in 2024, at $165,721, followed by Taiwanese households at $144,743. Taiwanese Americans were slightly higher on per capita income.
Do Indian Americans earn more than Chinese Americans?
Yes. The 2024 median household income was $165,721 for Asian Indian households and $111,125 for Chinese American households.
Are Indian Americans wealthier than Jewish Americans?
There is no like-for-like data. Pew found 23% of Jewish adults reported family incomes of $200,000 or more in 2020, while Census data shows about 30% of Asian Indian households at that level, but the surveys measure different things.
Do Indian Americans have more wealth than white Americans?
No official survey reports Indian-only wealth nationally. Asian American families as a whole had a higher median net worth than white families in the Federal Reserve's 2022 survey.
Sources
Figures are from the public sources below, with the data year stated. Estimates are labeled as estimates. Accessed October 24, 2026.
- U.S. Census Bureau, Selected Population Profile in the United States (S0201): Asian Indian alone and comparison groups, 2024 ACS 1-year estimates (2025). data.census.gov ↩ ↩ ↩
- U.S. Census Bureau, Selected Population Profile in the United States (S0201): Total population, 2024 ACS 1-year estimates (2025). data.census.gov ↩ ↩
- Federal Reserve Board (FEDS Notes), Greater Wealth, Greater Uncertainty: Changes in Racial Inequality in the Survey of Consumer Finances (accessible data) (2023). federalreserve.gov ↩ ↩ ↩
- Pew Research Center, Income inequality is greater among Chinese Americans than any other Asian origin group in the U.S. (2024). pewresearch.org ↩
- Pew Research Center, Jewish Americans in 2020 (2021). pewresearch.org ↩
- U.S. Census Bureau, Household Income in the Past 12 Months (B19001), 2017–2021 ACS 5-year Selected Population Detailed Tables (2023). data.census.gov ↩
- U.S. Census Bureau, Wealth of Households: 2023 (P70BR-211) (2025). www2.census.gov ↩
- UCLA Asian American Studies Center, The Color of Wealth in Los Angeles (press release) (2016). aasc.ucla.edu ↩