
Short answer
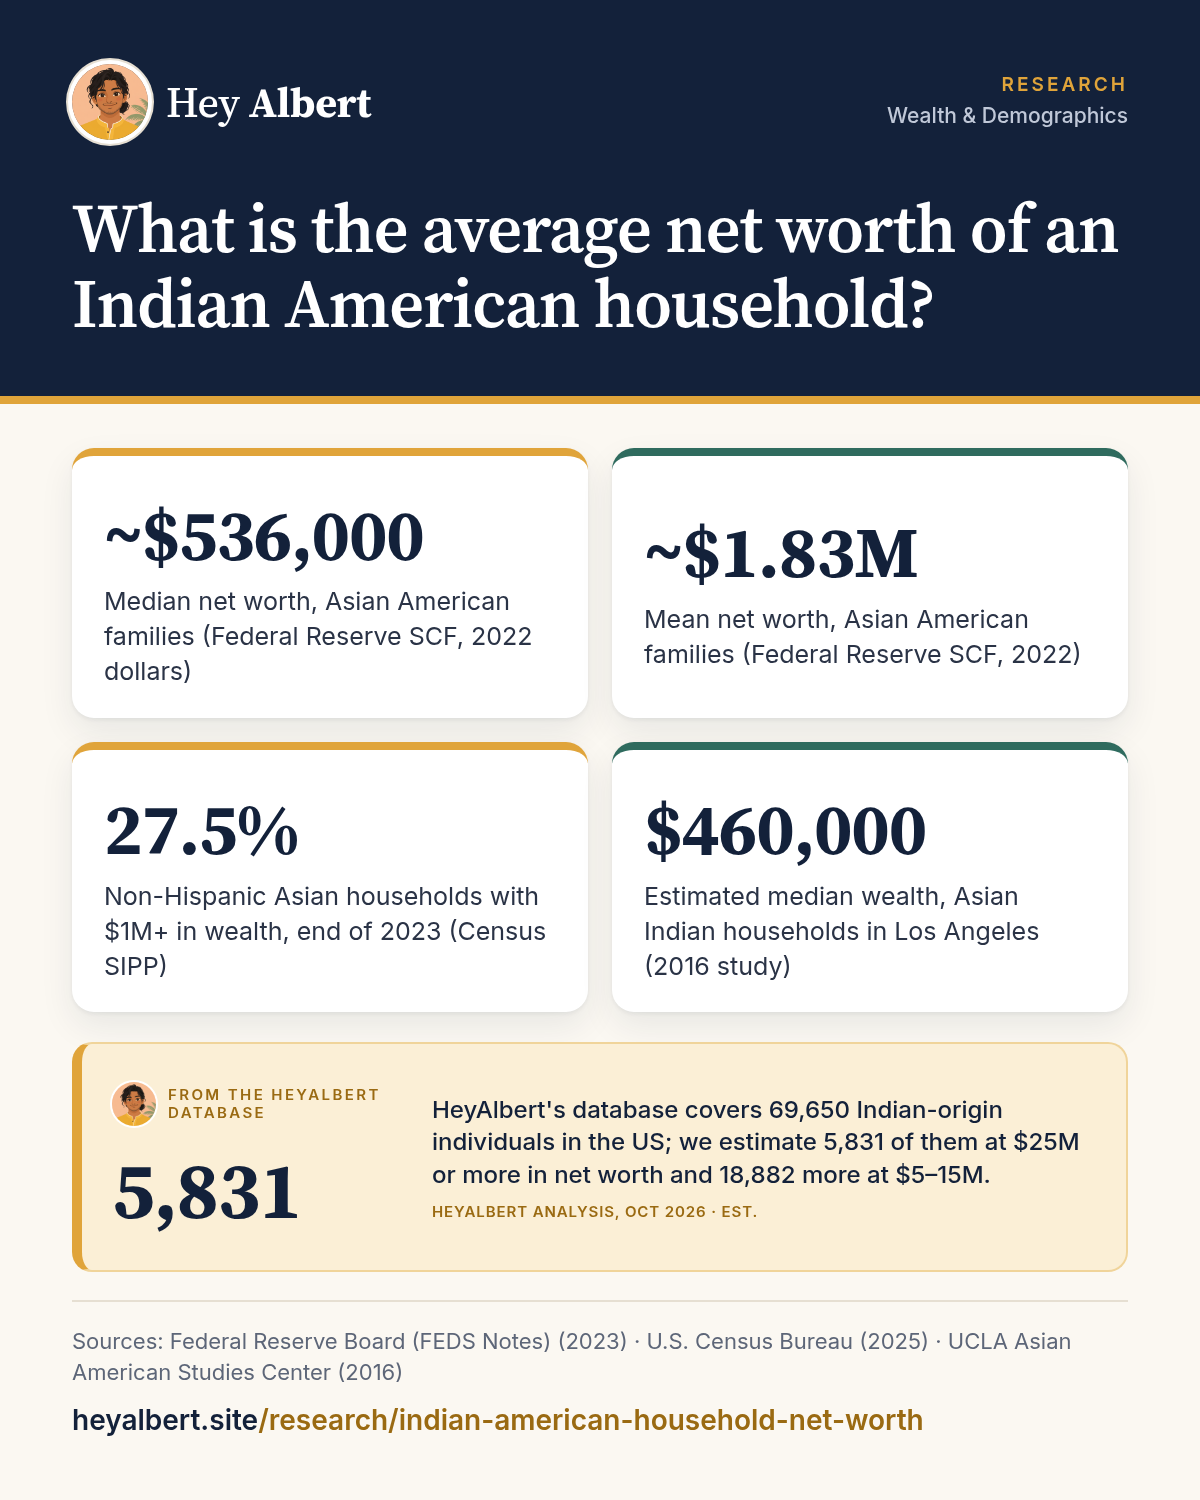
No federal survey publishes a national net worth figure for Indian American households specifically. The closest official benchmark is the Federal Reserve's 2022 Survey of Consumer Finances, which put median net worth for Asian American families at about $536,000 and the mean at about $1.83 million, versus $285,000 and $1.37 million for white families1. A 2016 study of the Los Angeles area, one of the few to measure the group directly, estimated median Asian Indian household wealth at $460,0004.
HeyAlbert data shows HeyAlbert's database covers 69,650 Indian-origin individuals in the US; we estimate 5,831 of them at $25M or more in net worth and 18,882 more at $5–15M. See the data · Methodology
Why there is no single official number
Net worth is everything a household owns (savings, investments, retirement accounts, home equity, business stakes) minus everything it owes. Measuring it takes long, detailed surveys, and the samples are too small to report on most individual ethnic groups. The Federal Reserve's Survey of Consumer Finances (SCF) only began separating Asian families from other groups with its 2022 survey, thanks to an oversample of Asian households1. The Census Bureau's wealth survey, the Survey of Income and Program Participation (SIPP), reports for Asian households overall but not by country of origin3.
So any figure claiming to be the "average net worth of Indian Americans" nationally is an estimate built on broader data. What we can do is set out the best evidence and what it implies. Income data is much richer, as covered in Indian American median household income.
What HeyAlbert data shows
The best national benchmark: Asian American households
Asian Indians are one of the two largest Asian origin groups in the US, about 5.1 million of the 21.3 million people who identified as Asian alone in 20245,6, so broad Asian American figures are a meaningful, if imperfect, starting point. Three national sources describe Asian American wealth:
| Source | Asian households | White households |
|---|---|---|
| Federal Reserve SCF 2022, median1 | ~$536,000 | ~$285,000 |
| Federal Reserve SCF 2022, mean1 | ~$1.83 million | ~$1.37 million |
| Census SIPP, median, 2021 (Pew analysis)2 | $320,900 | $250,400 |
| Census SIPP, households with $1M+, end of 20233 | 27.5% | 22.2% |
The two surveys differ because the SCF deliberately oversamples wealthy families, while SIPP tends to capture less of the wealth held at the top. SIPP also shows fewer Asian households at the bottom: 6.7% of non-Hispanic Asian households had zero or negative wealth at the end of 2023, compared with 8.5% of non-Hispanic white households3. The Federal Reserve's latest survey, for 2025, put median net worth for all US families at $215,900 and the mean at $1.24 million7. Its race-specific results for 2025 had not been published in the same form as of this writing.
What the evidence suggests for Indian Americans
Because Asian Indian households earn far more than the Asian average (a median of $165,721 versus $117,289 in 2024)5,6, it is reasonable to expect their typical net worth to sit at or above the Asian benchmark. That is an inference, not a measurement. The one direct estimate we found comes from "The Color of Wealth in Los Angeles," a 2016 study by researchers at UCLA, Duke and The New School. It estimated median wealth of $460,000 for Asian Indian households in the Los Angeles area, compared with $355,000 for white households and $592,000 for Japanese American households4. It covers one metro area and data from more than a decade ago, so it should be read as a signal, not a national figure.
Wealth also follows age. The median age of Asian Indian immigrants is 40.9, and half arrived in 2010 or later8,5, so many households are still in their peak earning and saving years. For a look at what this means over time, see the coming wealth transfer in Indian American families.
Where the wealth sits: homes, retirement accounts and equity
Housing is one visible part of the balance sheet. In 2024, 63.0% of Asian Indian households owned their home, and the median value of those homes was $678,000, nearly double the US median of $360,6005,6. Homes are concentrated in high-cost metros such as the San Francisco Bay Area, New York and Seattle, which raises both values and mortgage balances.
Debt is the other side. The Urban Institute's SCF analysis found Asian families had the highest median debt-to-income ratio of any group (1.5), and that 97% of their debt was mortgages or student loans9. Much of the wealth built by tech professionals also sits in employer stock and retirement plans rather than cash; we cover this in how equity compensation drives Indian American wealth and how Indian Americans invest.
A wide spread around the middle
Medians hide extremes. Among Asian American households in the 2022 SCF, the 90th percentile of net worth was more than $3 million, about 230 times the $13,040 at the 10th percentile9. Recent arrivals, students and households on temporary visas often have little wealth, while long-settled professionals and business owners may have a great deal. For the very top, see how many Indian American millionaires and billionaires there are, and for how this compares with other groups, Indian American wealth compared with other groups.
Frequently asked questions
What is the median net worth of Indian American households?
There is no official national figure for Indian Americans alone. The Federal Reserve's 2022 survey put median net worth for Asian American families at about $536,000, and Indian American households, with higher incomes than the Asian average, likely sit at or above that level.
What is the average (mean) net worth of Asian American families?
About $1.83 million in the Federal Reserve's 2022 Survey of Consumer Finances, pulled up by very wealthy households. The median, about $536,000, is a better guide to a typical family.
How many Asian American households are millionaires?
The Census Bureau found 27.5% of non-Hispanic Asian households had wealth of $1 million or more at the end of 2023, compared with 22.2% of non-Hispanic white households.
Why is wealth data for Indian Americans so limited?
Wealth surveys are expensive and their samples are too small to break out most origin groups. The Federal Reserve's survey only began reporting Asian families separately in 2022.
Sources
Figures are from the public sources below, with the data year stated. Estimates are labeled as estimates. Accessed October 24, 2026.
- Federal Reserve Board (FEDS Notes), Greater Wealth, Greater Uncertainty: Changes in Racial Inequality in the Survey of Consumer Finances (accessible data) (2023). federalreserve.gov ↩ ↩ ↩
- Pew Research Center, Wealth gaps across racial and ethnic groups (2023). pewresearch.org ↩
- U.S. Census Bureau, Wealth of Households: 2023 (P70BR-211) (2025). www2.census.gov ↩ ↩ ↩
- UCLA Asian American Studies Center, The Color of Wealth in Los Angeles (press release) (2016). aasc.ucla.edu ↩ ↩ ↩
- U.S. Census Bureau, Selected Population Profile in the United States (S0201): Asian Indian alone, 2024 ACS 1-year estimates (2025). data.census.gov ↩ ↩ ↩
- U.S. Census Bureau, Selected Population Profile in the United States (S0201): Asian alone and Total population, 2024 ACS 1-year estimates (2025). data.census.gov ↩ ↩ ↩
- Federal Reserve Board, Federal Reserve Board releases results of the 2025 Survey of Consumer Finances (2026). federalreserve.gov ↩
- Pew Research Center, Facts about Indians in the U.S. (2025). pewresearch.org ↩
- Urban Institute, A Snapshot of Asian Wealth in America (2025). apps.urban.org ↩ ↩