
Short answer
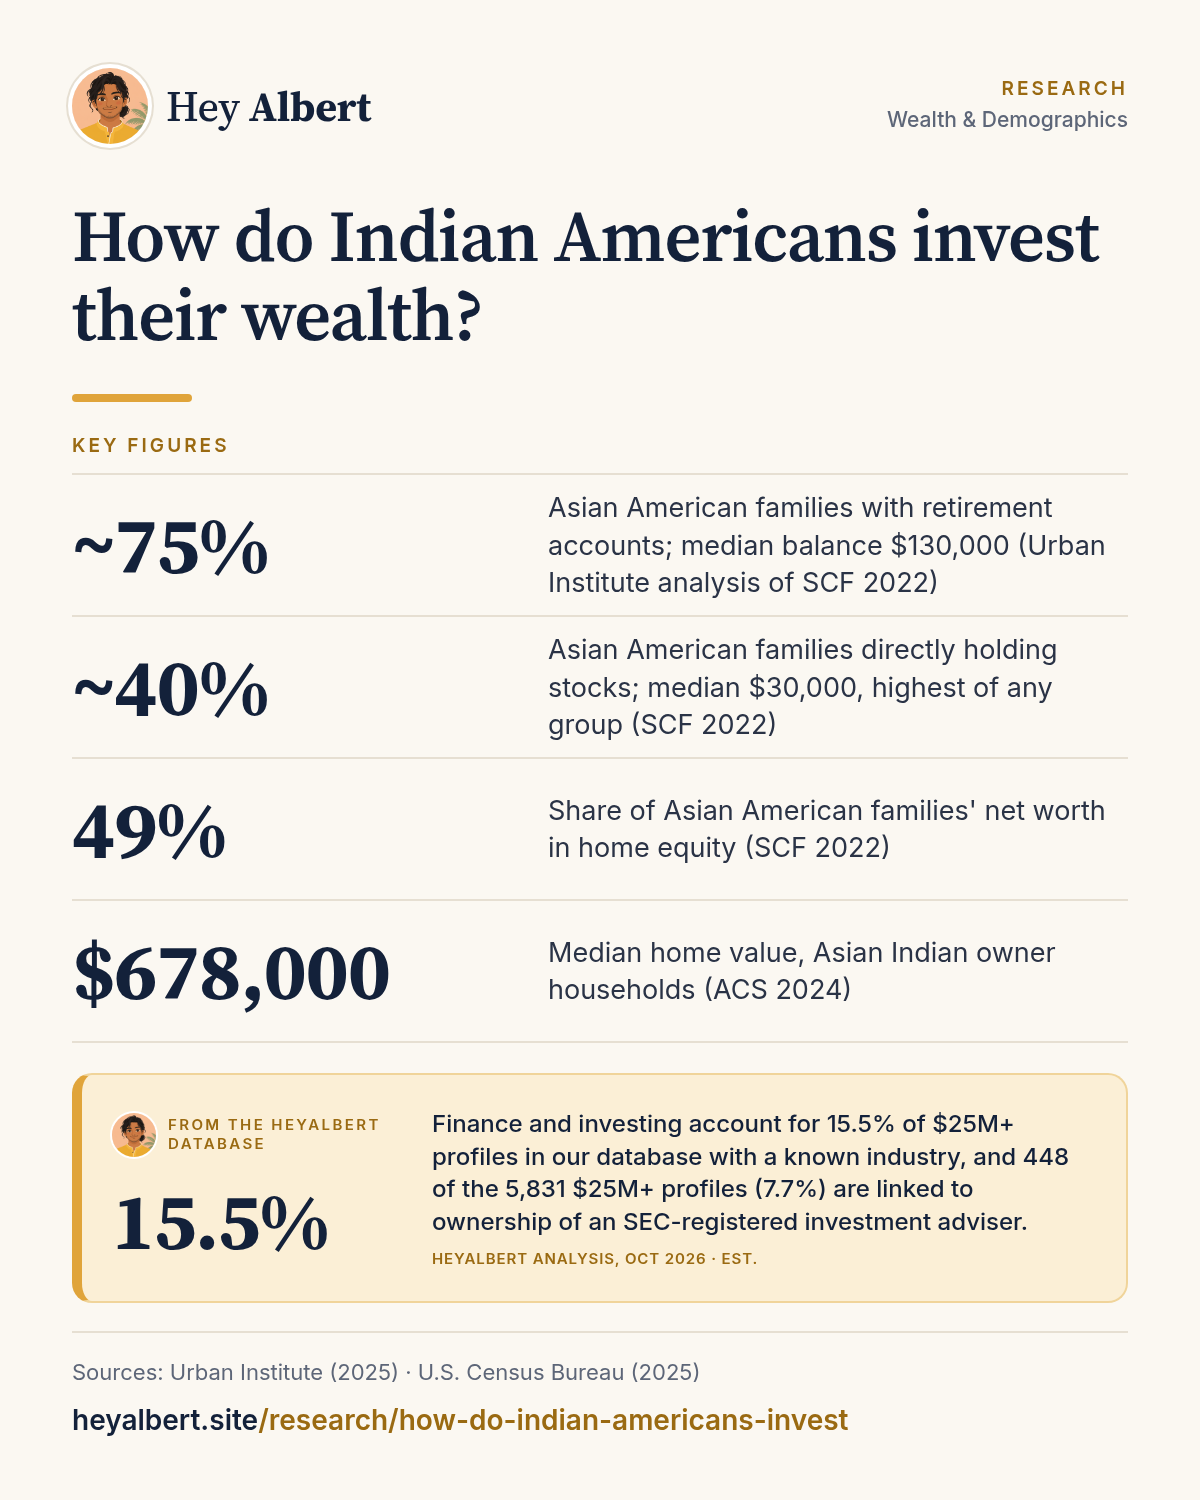
No survey tracks Indian American portfolios specifically, but the best proxy, Federal Reserve data on Asian American families, shows wealth concentrated in homes, retirement accounts and stocks: nearly 75% invest in retirement accounts (median $130,000), about 40% hold stocks directly, and home equity makes up 49% of net worth1. Indian Americans add distinctive layers, including high-value homes, employer stock from tech careers, angel investing and assets in India2,3.
HeyAlbert data shows finance and investing account for 15.5% of $25M+ profiles in our database with a known industry, and 448 of the 5,831 $25M+ profiles (7.7%) are linked to ownership of an SEC-registered investment adviser. See the data · Methodology
The data gap, and the best proxy
The Federal Reserve's Survey of Consumer Finances (SCF), the gold standard for household balance sheets, has reported Asian American families separately only since 2022 and does not break out Indian Americans1. The Urban Institute's detailed analysis of that 2022 data is the best available guide to how Asian American families invest, with the caveat that Asian Indian households earn considerably more than the Asian average (a median of $165,721 versus $117,289 in 2024)2,4. Urban concluded that Asian families on average have financial portfolios similar to those of white families, with substantial variation1.
What HeyAlbert data shows
Homes: the largest asset
For most families, the home is the biggest investment. Among Asian American families, home equity accounts for 49% of net worth, and mortgage debt equals about half (49%) of their aggregate housing wealth; only 29% of Asian homeowners own outright1. Asian Indian households fit this pattern: 63.0% owned their home in 2024, the median home was worth $678,000, and median monthly costs for owners with a mortgage were $3,6032. Those values reflect concentration in expensive metros such as the Bay Area, New York, New Jersey and Seattle; see Indian American income by metro area. For property beyond the family home, see Indian American real estate developers.
Retirement accounts and stocks
Nearly 75% of Asian American families have retirement savings, with a median of $130,000, held in employer plans such as 401(k)s, IRAs and pensions1. With 87.2% of employed Asian Indians working as private-sector employees in 20242, employer-sponsored plans are a central channel. Roughly 40% of Asian families also hold stocks directly, outside retirement accounts, with the highest median value of any group ($30,000), and they hold more in other direct investments (median $80,000) than other groups1. Nationally, 56% of all US families held stocks directly or indirectly in 2025, according to the Federal Reserve5.
Most Indian American households are still accumulating rather than drawing down. Only 9.6% of Asian Indian households received retirement income in 2024, compared with 24.4% of all US households, and 12.8% received Social Security, against 31.6% nationally2,6. That reflects the community's young age profile, and it means decisions about how to save, diversify and eventually draw down retirement assets are still ahead for many families.
Equity compensation: the tech factor
A distinctive feature for many Indian American households is pay in company stock. In 2024, 27.3% of employed Asian Indians worked in professional, scientific and management services, which includes software and IT, and 75.7% held management, business, science and arts occupations2. Restricted stock units and options can make a single employer's shares a large part of a household's wealth, which creates both upside and concentration risk. We look at this in how equity compensation drives Indian American wealth and, for founders, the largest Indian American IPOs and exits.
Business ownership and private investments
Nearly one in seven Asian American families owns a business, similar to white families, and those businesses carry a median equity of $408,000, nearly four times the median for white business-owning families1. Asian business owners have a net worth more than four times that of non-owners1. Among Asian Indians, unincorporated self-employment is relatively low (3.1% of workers in 2024, versus 5.9% nationally)2,6, so business wealth tends to be concentrated in incorporated ventures, family enterprises such as hotels, and startups. Many successful founders and executives reinvest through angel groups; see Indian American angel investors.
Investments in India
Many Indian Americans also hold assets in India, from property and bank deposits to equities, and support family there. The US was the largest source of India's inward remittances in 2023-24, at 27.7%, up from 23.4% in 2020-213. Remittances include everyday family support as well as investment flows, and the RBI found that transfers larger than ₹5 lakh made up about 29% of remittance value in 2023-243. Holding assets in two countries brings reporting obligations in the US, covered in FBAR, FATCA and the US–India tax treaty, and practical questions covered in do Indian Americans own property in India.
Debt and risk
Asian American families carry relatively high debt for their incomes, the highest median debt-to-income ratio (1.5) of any group, but 97% of their debt is mortgages or student loans1. Wealth is also unevenly spread: at the 10th percentile, Asian families had just $3,900 in retirement savings1. For a broader view, see Indian American household net worth.
Frequently asked questions
What do Indian Americans invest in?
Mostly homes, employer retirement plans and stocks, based on Federal Reserve data for Asian American families. Many Indian Americans also hold employer stock from tech careers, private business stakes and assets in India.
Do Asian American families invest in the stock market?
Yes. About 40 percent hold stocks directly, with the highest median value of any group, and nearly 75 percent have retirement accounts, according to the Urban Institute's analysis of 2022 Federal Reserve data.
Do Indian Americans favor residential or commercial real estate?
No public data splits Indian American real estate holdings this way. Census data shows high homeownership in expensive markets, and some families also invest in hotels and commercial property.
Is there data on Indian American investment portfolios specifically?
Not from national surveys. The Federal Reserve reports Asian American families as one group, so Indian American figures have to be inferred.
Sources
Figures are from the public sources below, with the data year stated. Estimates are labeled as estimates. Accessed October 24, 2026.
- Urban Institute, A Snapshot of Asian Wealth in America (2025). apps.urban.org ↩ ↩ ↩
- U.S. Census Bureau, Selected Population Profile in the United States (S0201): Asian Indian alone, 2024 ACS 1-year estimates (2025). data.census.gov ↩ ↩ ↩
- Reserve Bank of India, Changing Dynamics of India's Remittances – Insights from the Sixth Round of India's Remittances Survey (2025). rbi.org.in ↩ ↩ ↩
- U.S. Census Bureau, Selected Population Profile in the United States (S0201): Asian alone, 2024 ACS 1-year estimates (2025). data.census.gov ↩
- Federal Reserve Board, Federal Reserve Board releases results of the 2025 Survey of Consumer Finances (2026). federalreserve.gov ↩
- U.S. Census Bureau, Selected Population Profile in the United States (S0201): Total population, 2024 ACS 1-year estimates (2025). data.census.gov ↩ ↩