
Short answer
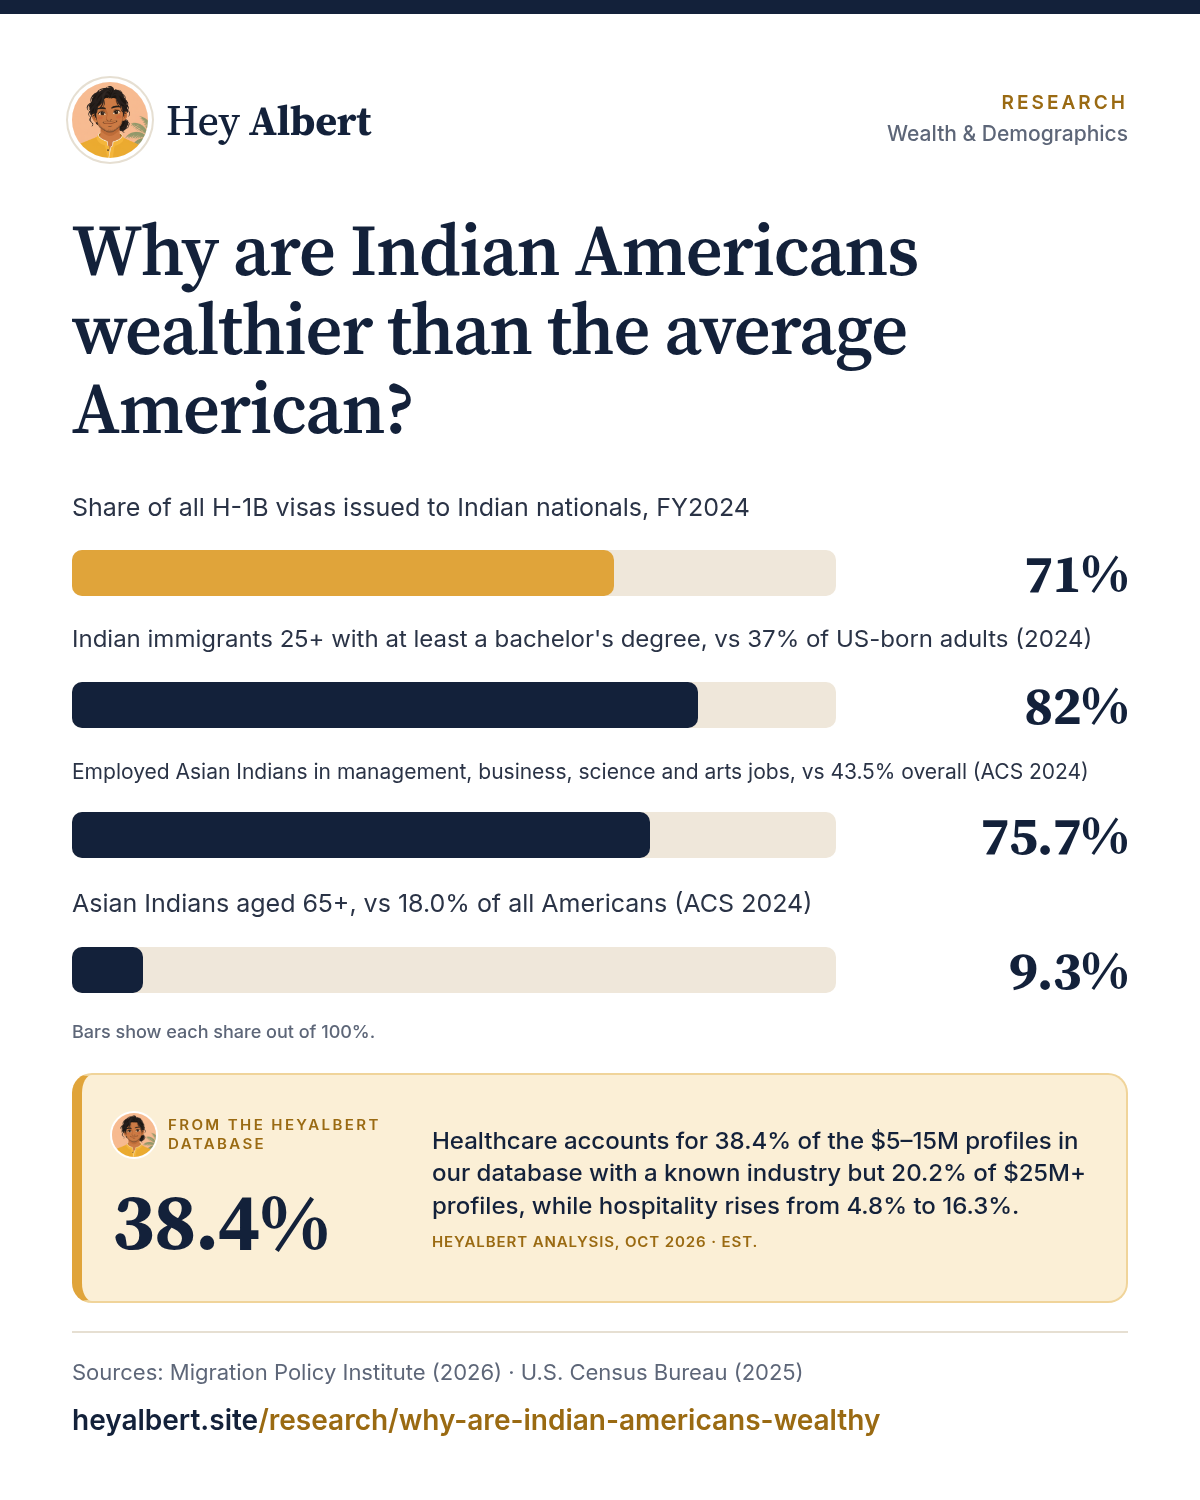
Most of the gap is explained by who has immigrated. US visa rules have favored highly educated professionals: Indian nationals received 71% of all H-1B skilled-worker visas in fiscal 2024, and 82% of Indian immigrant adults hold at least a bachelor's degree1. That education feeds into high-paying jobs (75.7% of employed Asian Indians work in management, business, science and arts occupations, versus 43.5% of all workers), and a young, largely married population with many two-earner households adds to it2,3.
HeyAlbert data shows healthcare accounts for 38.4% of the $5–15M profiles in our database with a known industry but 20.2% of $25M+ profiles, while hospitality rises from 4.8% to 16.3%. See the data · Methodology
Start with the numbers
In 2024, households headed by an Asian Indian had a median income of $165,721, about twice the US median of $81,6042,3. Households headed by an Indian immigrant had a median of $176,200, according to the Migration Policy Institute1. We look at the figure in detail in Indian American median household income, and at how it ranks in are Indian Americans the richest ethnic group. The question here is why.
Researchers generally point to a handful of measurable factors rather than anything innate. None of them applies to every family, but together they account for most of the difference.
What HeyAlbert data shows
1. Selective immigration
Large-scale Indian immigration to the US only began after the Immigration and Nationality Act of 1965, which abolished national-origin quotas and opened routes for family reunification and skilled professionals1. Since then, the paths most open to Indians have rewarded education. In fiscal 2024, Indian nationals received 71% of all H-1B visas for highly skilled workers, and India was the leading source of international students in the 2024–25 academic year, most of them in STEM programs1. In fiscal 2023, 37% of Indians who received green cards did so through employment-based categories, more than double the share among all new permanent residents1.
About 69% of Asian Indians in the US were born abroad2, so this selection shapes the whole community's profile. Its effects also carry into the next generation: Pew found that households headed by a US-born Indian American had a median income of $120,200 in 2023, well above the national median even though most US-born Indian Americans are still young (their median age was 13.4)6. Our article on the role of the H-1B visa goes deeper.
2. Very high education levels
Education is the strongest single predictor of earnings in the US, and Asian Indians have the highest attainment of any large group. In 2024, 78.8% of Asian Indian adults aged 25 and older held at least a bachelor's degree and 46.4% held a graduate or professional degree, compared with 36.8% and 14.7% of all US adults2,3. Among Indian immigrants the figures were 82% and 50%1. See Indian American education levels for the full breakdown.
3. High-paying occupations and industries
That education translates into well-paid work. In 2024, 75.7% of employed Asian Indians worked in management, business, science and arts occupations, compared with 43.5% of all US workers2,3. By industry, 27.3% worked in professional, scientific and management services (which includes software and IT consulting), 22.7% in education and health care, and 10.7% in finance, insurance and real estate2. Mean earnings among Asian Indian earners were $212,461, against $116,533 nationally2,3. Two sectors stand out: technology, covered in Indian American tech founders and unicorns, and medicine, covered in Indian American doctors and physicians.
4. Age, work and household structure
The population is concentrated in prime working years. The median age of Asian Indians was 36.1 in 2024, and only 9.3% were 65 or older, compared with 18.0% of all Americans2,3. Labor force participation was 72.7%, versus 64.0% nationally2,3.
Households also tend to have more earners. Married-couple families made up 69.7% of Asian Indian households, compared with 46.7% of all US households, and average household size was 2.85 versus 2.502,3. A household with two professional incomes will have a much higher household income than one with a single earner, even if individual pay is similar. We look at this in how multigenerational living shapes household wealth.
5. Where they live
Indian Americans are concentrated in high-wage regions. California alone is home to about 971,000 Asian Indians, followed by Texas (668,000) and New Jersey (449,000), and the largest metro populations are in New York, Dallas–Fort Worth and the San Francisco Bay Area4. Pay in those labor markets is high, although so is the cost of living, which means headline incomes overstate the purchasing-power gap somewhat.
What this does not mean
These factors describe averages. Six percent of Indian immigrants lived in poverty in 20241, and incomes vary widely by visa status, length of residence, occupation and region. Pew's analysis shows that income inequality within the Indian American community has grown since 19805. The high median is best understood as the result of a highly selected immigrant flow into high-paying fields, not as a trait of a group. For the spread of outcomes, see income distribution among Indian Americans.
Frequently asked questions
Why do Indian Americans earn so much?
Mainly because US immigration has selected for highly educated professionals, who then work in well-paid fields like technology, medicine and finance. A young, mostly married population with many two-earner households adds to household incomes.
Is it because of the H-1B visa?
The H-1B is a big part of it. Indian nationals received 71% of H-1B visas in fiscal 2024, and many H-1B workers later move to green cards and citizenship, but family-based immigration and US-born Indian Americans also matter.
Are US-born Indian Americans also high earners?
Yes, though most US-born Indian Americans are still young. Pew found US-born-headed Indian households had a median income of $120,200 in 2023, well above the national median.
Do all Indian Americans have high incomes?
No. Around 6% of Indian immigrants lived in poverty in 2024, and recent arrivals, students and some workers in service jobs earn far less than the median.
Sources
Figures are from the public sources below, with the data year stated. Estimates are labeled as estimates. Accessed October 24, 2026.
- Migration Policy Institute, Indian Immigrants in the United States (2026). migrationpolicy.org ↩ ↩ ↩
- U.S. Census Bureau, Selected Population Profile in the United States (S0201): Asian Indian alone, 2024 ACS 1-year estimates (2025). data.census.gov ↩ ↩ ↩
- U.S. Census Bureau, Selected Population Profile in the United States (S0201): Total population, 2024 ACS 1-year estimates (2025). data.census.gov ↩ ↩ ↩
- U.S. Census Bureau, Selected Population Profile (S0201): Asian Indian alone, by state and metro area, 2024 ACS 1-year estimates (2025). data.census.gov ↩
- Pew Research Center, Income inequality is greater among Chinese Americans than any other Asian origin group in the U.S. (2024). pewresearch.org ↩
- Pew Research Center, Facts about Indians in the U.S. (2025). pewresearch.org ↩