
Short answer
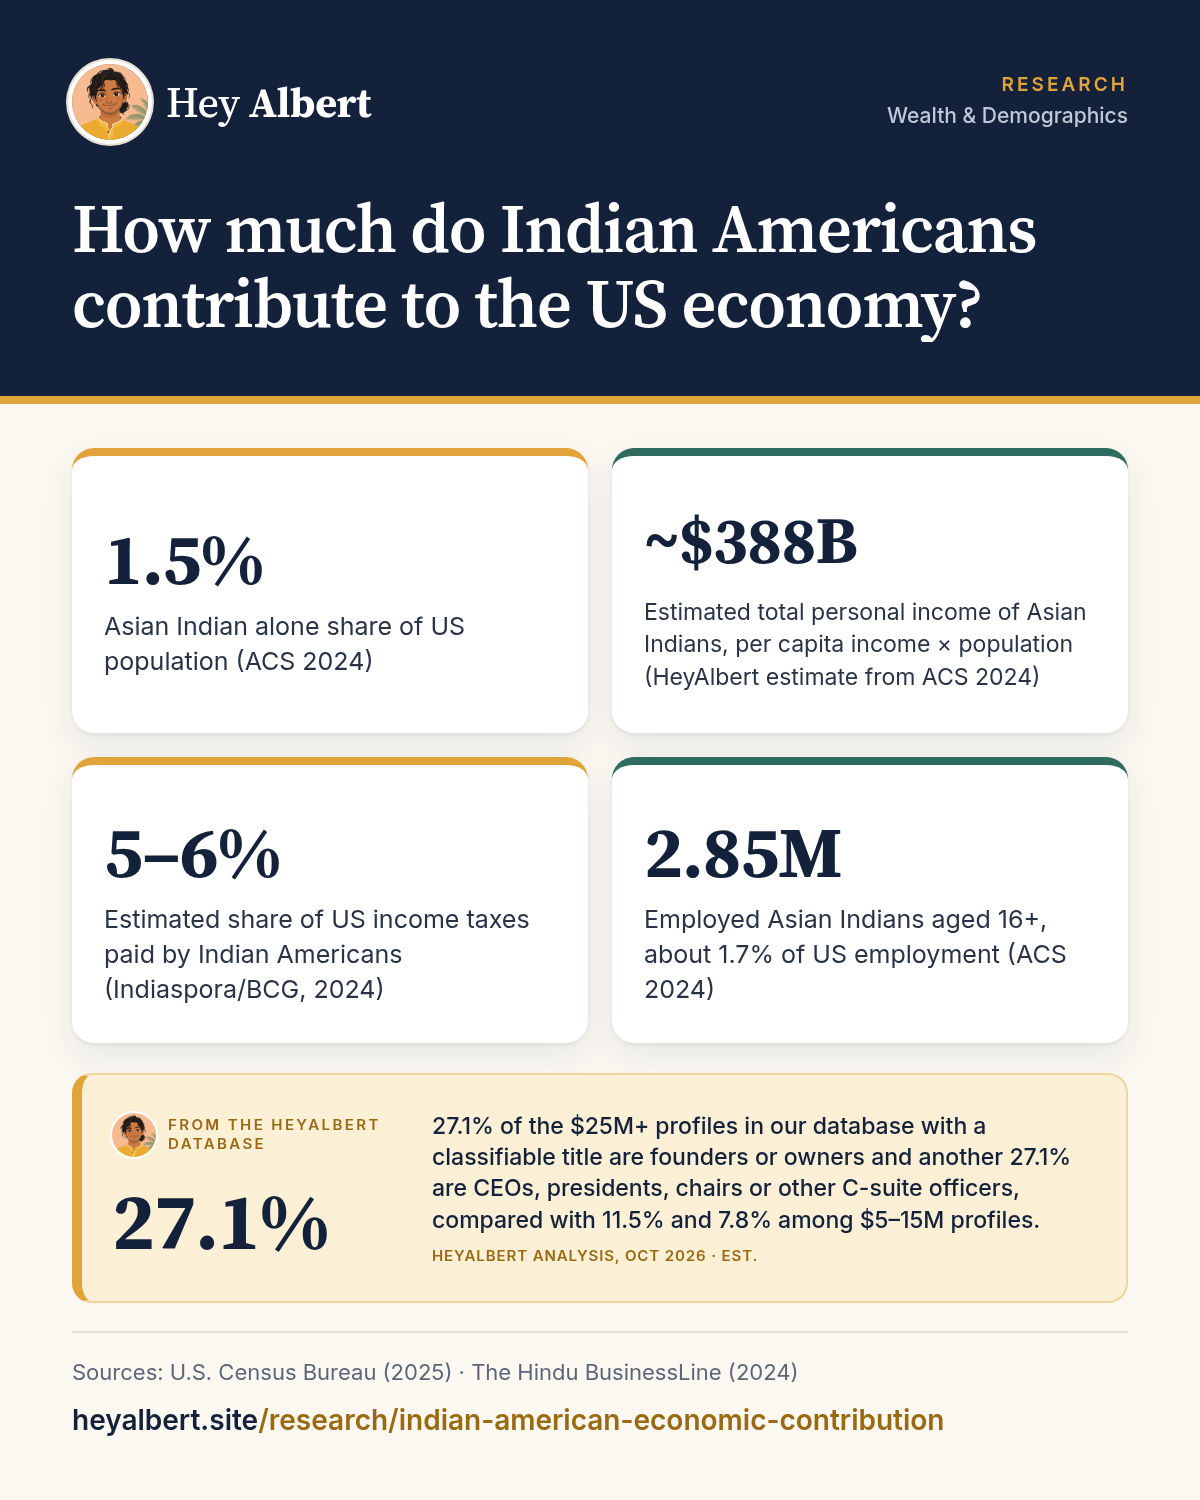
Indian Americans make up about 1.5% of the US population1 but, on our estimate from Census data, receive roughly 2.5% of all personal income, around $388 billion a year1,2. A 2024 report by Indiaspora and Boston Consulting Group estimated that they pay 5–6% of all US income taxes, roughly $250–300 billion3,4. These are estimates; no official statistic measures the group's total economic output.
HeyAlbert data shows 27.1% of the $25M+ profiles in our database with a classifiable title are founders or owners and another 27.1% are CEOs, presidents, chairs or other C-suite officers, compared with 11.5% and 7.8% among $5–15M profiles. See the data · Methodology
Why there is no single official number
Questions such as "how much do Indian Americans contribute to GDP" have no official answer. GDP is measured by industry and region, not by the ethnicity of workers or owners, and the IRS does not publish tax data by ethnicity. What we can do is build estimates from Census income data and point to credible third-party studies, while being clear about what each one measures. Below we use three kinds of evidence: Census income and employment data, a widely cited 2024 report on the diaspora, and counts of business leaders and founders.
What HeyAlbert data shows
Income: an estimate from Census data
In 2024, 5,094,694 people identified as Asian Indian alone, 1.5% of the US population of about 340 million1,2. Their per capita income was $76,212, against $45,256 for the country as a whole1,2. Multiplying per capita income by population gives an approximate total personal income of about $388 billion for Asian Indians, around 2.5% of the US total calculated the same way. That is a rough estimate from survey data, not an official aggregate, and it excludes the roughly 465,000 people who identify as Asian Indian in combination with another group1.
Most of this income is earned from work. In 2024, 92.9% of Asian Indian households had earnings, and about 2.85 million Asian Indians were employed, roughly 1.7% of all US workers1,2. Labor force participation was 72.7%, well above the national 64.0%1,2. The population behind these numbers is also growing quickly: the Asian Indian alone population rose from about 4.24 million in 2019 to 5.09 million in 2024, an increase of roughly 20% in five years1,5, so the community's share of national income has been rising. Their concentration in professional jobs is covered in why Indian Americans are wealthier than average, and the income figures in Indian American median household income.
Taxes: the Indiaspora and BCG estimate
The most widely cited estimate comes from "Small Community, Big Contributions," a 2024 report by the nonprofit Indiaspora, researched by Boston Consulting Group. Indiaspora's announcement stated that Indian Americans pay 6% of all US taxes3, and press coverage of the report described the figure as about 5–6% of US income taxes, roughly $250–300 billion4. The report's methodology is not public in the sources we reviewed, so the figure should be treated as an estimate. Progressive income tax rates mean a group with high incomes will pay a larger share of income taxes than its share of income, so a tax share well above the 2.5% income share is plausible.
Business and innovation
The same report highlighted several contributions beyond wages3,4:
- Corporate leadership: 16 Fortune 500 companies were led by CEOs of Indian origin, companies with about $978 billion in combined revenue3.
- Startups: Indians had co-founded 72 of the 648 US unicorns (privately held startups valued at $1 billion or more) operating as of 2024, companies employing more than 55,000 people4.
- Science: members of the diaspora were associated with more than 10% of NIH grants and US patents3.
- Academia: about 23,000 full-time Indian professors taught at US colleges and universities3.
We look at these areas in depth in Indian American Fortune 500 CEOs and Indian American tech founders and unicorns.
Hotels, medicine and small business
Some of the largest contributions are in sectors where Indian Americans are heavily represented as owners and professionals. Indian American families own a large share of US hotels and motels, a story we tell in how many hotels Indian Americans own. In medicine, Indian American physicians are a significant part of the US doctor workforce; see Indian American doctors and physicians. In 2024, 22.7% of employed Asian Indians worked in education, health care and social assistance1.
Philanthropy and giving
Economic contribution also includes giving. The Indiaspora report counted donations by Indian Americans to US universities totaling more than $3 billion, including 67 gifts of $1 million or more to more than 40 universities3. For the largest gifts and causes, see Indian American philanthropy.
Reading these numbers carefully
Population-share comparisons can exaggerate. Indian Americans are concentrated in high-wage metros and working ages (only 9.3% are 65 or older, versus 18.0% nationally)1,2, so some of the outsized contribution reflects where and at what life stage people are, as well as what they do. The figures above are best read as a sign of a highly productive, mostly working-age community rather than precise accounting.
Frequently asked questions
What percentage of US taxes do Indian Americans pay?
A 2024 report by Indiaspora and Boston Consulting Group estimated about 5 to 6 percent of US income taxes, or roughly 250 to 300 billion dollars a year. It is an estimate; the IRS does not publish tax data by ethnicity.
How much do Indian Americans contribute to GDP?
There is no official figure, because GDP is not measured by ethnicity. Based on Census income data, Asian Indians receive roughly 2.5 percent of US personal income while making up about 1.5 percent of the population.
What share of the US population is Indian American?
About 1.5 percent. In 2024, 5.09 million people identified as Asian Indian alone, and about 5.56 million as Asian Indian alone or in combination.
How many US unicorns have Indian founders?
According to the Indiaspora and BCG report, Indians had co-founded 72 of the 648 US unicorns operating as of 2024.
Sources
Figures are from the public sources below, with the data year stated. Estimates are labeled as estimates. Accessed October 24, 2026.
- U.S. Census Bureau, Selected Population Profile in the United States (S0201): Asian Indian alone, 2024 ACS 1-year estimates (2025). data.census.gov ↩ ↩ ↩
- U.S. Census Bureau, Selected Population Profile in the United States (S0201): Total population, 2024 ACS 1-year estimates (2025). data.census.gov ↩ ↩ ↩
- Indiaspora, Indiaspora Releases Report on Impact of Indian Diaspora in America (press release, GlobeNewswire) (2024). finance.yahoo.com ↩ ↩ ↩
- The Hindu BusinessLine, Indian Americans pay 5-6% of income taxes in the US, report says (2024). thehindubusinessline.com ↩ ↩ ↩
- U.S. Census Bureau, Selected Population Profile in the United States (S0201): Asian Indian alone, 2019 ACS 1-year estimates (2020). data.census.gov ↩