
Short answer
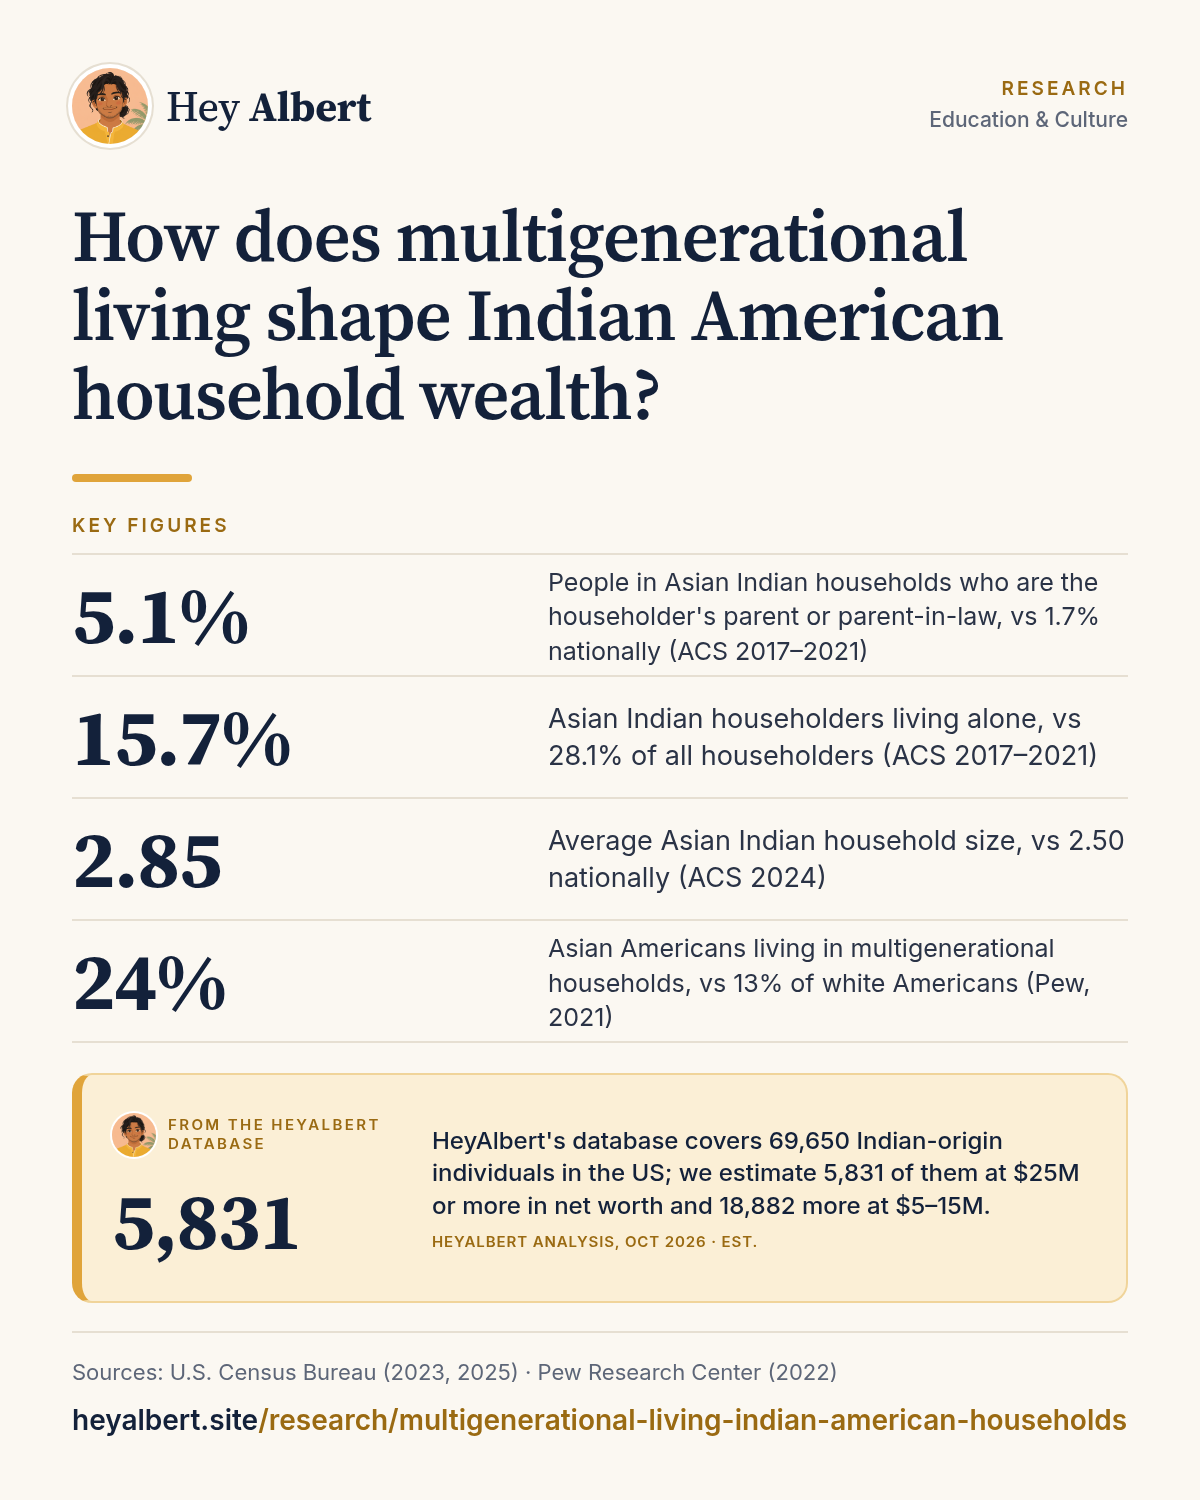
Indian American households are much more likely than average to include parents or parents-in-law of the householder: 5.1% of people in Asian Indian households held that role in 2017–2021, versus 1.7% nationally, and only 15.7% of Asian Indian householders lived alone, versus 28.1% of all householders1. Shared households can pool income and costs, which raises measured household income and can speed up saving, though it also means income is spread across more people2,3.
HeyAlbert data shows HeyAlbert's database covers 69,650 Indian-origin individuals in the US; we estimate 5,831 of them at $25M or more in net worth and 18,882 more at $5–15M. See the data · Methodology
How common is multigenerational living?
Nationally, 18% of Americans lived in multigenerational households in 2021, according to Pew Research Center, up from 7% in 19712. The share was 24% for Asian Americans, 26% for Black and Hispanic Americans and 13% for white Americans, and immigrants (26%) were more likely than the US-born (17%) to live this way2. Pew does not publish a figure for Indian Americans alone, but Census Bureau tables on household relationships give a close picture.
In the Census Bureau's 2017–2021 detailed tables, 5.1% of people living in Asian Indian households were the householder's parent or parent-in-law, three times the national share of 1.7% and more than four times the share among non-Hispanic white households (1.1%)1. In the other direction, only 0.6% were grandchildren of the householder, compared with 2.4% nationally1. The typical arrangement, in other words, is an adult couple whose parents have joined them, not grandparents raising grandchildren. Adult siblings living with a householder were also less common than average (0.95% versus 1.23%)1.
What HeyAlbert data shows
Bigger, fuller households
The result is larger households with fewer people living alone. In 2024, Asian Indian households averaged 2.85 people, compared with 2.50 for all US households3,4. In 2017–2021, just 15.7% of Asian Indian householders lived alone, versus 28.1% of all householders and 29.2% of non-Hispanic white householders1. Married couples head 69.7% of Asian Indian households, compared with 46.7% nationally3,4. Many of these are two-earner professional couples, a pattern we discuss in why Indian Americans are wealthier than average.
Age profile matters here. Only 9.3% of Asian Indians were 65 or older in 2024, against 18.0% of all Americans3,4, so the older generation in many households is a small group relative to working-age adults.
Grandparents in the home, but rarely as sole caregivers
The 2024 survey adds another angle. Among Asian Indians aged 30 and over, 4.0% were grandparents living with their grandchildren, compared with 3.1% of all Americans3,4. But only 8.7% of those co-resident Asian Indian grandparents were responsible for the grandchildren's basic needs, compared with 30.7% nationally3,4. That fits the pattern in the relationship data: grandparents typically join a household headed by their working-age children and help out, rather than raising grandchildren in place of absent parents. For families, the practical effect can be lower childcare costs and more flexibility for two working parents, which supports both earnings and saving.
How shared living affects income and wealth
Multigenerational arrangements affect household finances in several ways:
- More earners or contributors. Pew notes that some multigenerational households have more earners, which acts as a safety net if one person loses a job2.
- Shared fixed costs. One mortgage, one set of utilities and shared childcare can free up income for saving and investing.
- Lower poverty. Nationally, 10% of people in multigenerational households lived in poverty, compared with 12% in other households2.
- More people per dollar. Larger households must stretch income across more people, which is why per capita income tells a different story from household income.
These effects help explain why household income figures, such as the $165,721 Asian Indian median in 20243, look especially high. See Indian American median household income for how household, family and per capita measures differ.
Housing choices
Bigger households need bigger homes, often in high-cost metros. In 2024, 63.0% of Asian Indian households owned their home and the median value of those homes was $678,000, against $360,600 nationally3,4. Median monthly owner costs for Asian Indian households with a mortgage were $3,603, compared with $2,035 nationally, and Asian Indian renters paid a median gross rent of $2,002 a month, against $1,487 for all renters3,4. Pooling resources across generations can make such purchases more feasible. We look at real estate as an asset in how culture shapes saving, gold and real estate habits.
Caregiving, inheritance and the next generation
Living together also shapes how wealth moves between generations. Parents who join adult children may contribute savings, help with childcare or need care themselves, and assets may pass in the household long before any formal inheritance. Most Asian Indian immigrants arrived recently (72.2% entered the US in 2000 or later3), so as this cohort ages, these arrangements will matter more for estate and succession planning; see the coming wealth transfer in Indian American families and cross-border estate planning for Indian Americans. For how the second generation is faring, see second-generation Indian American income.
Frequently asked questions
Do Indian American families live in multigenerational households?
More often than average. In Census data, 5.1% of people in Asian Indian households were the householder's parent or parent-in-law, three times the national share.
How many Asian Americans live in multigenerational homes?
About 24% of Asian Americans lived in multigenerational households in 2021, according to Pew Research Center, compared with 18% of all Americans and 13% of white Americans.
Does multigenerational living increase household income?
It can raise household income because there may be more earners under one roof, and it lets families share costs. It also means income is spread across more people.
Are Indian American households larger than average?
Yes. They averaged 2.85 people in 2024, compared with 2.50 for all US households.
Sources
Figures are from the public sources below, with the data year stated. Estimates are labeled as estimates. Accessed October 24, 2026.
- U.S. Census Bureau, Household Type by Relationship for the Population in Households (B09019), 2017–2021 ACS 5-year Selected Population Detailed Tables (2023). data.census.gov ↩ ↩ ↩
- Pew Research Center, The demographics of multigenerational households (2022). pewresearch.org ↩ ↩ ↩
- U.S. Census Bureau, Selected Population Profile in the United States (S0201): Asian Indian alone, 2024 ACS 1-year estimates (2025). data.census.gov ↩ ↩ ↩
- U.S. Census Bureau, Selected Population Profile in the United States (S0201): Total population, 2024 ACS 1-year estimates (2025). data.census.gov ↩ ↩ ↩